


Table of Contents
Amazon Brand Analytics gets wasted when teams treat it like reference material instead of a decision tool. The value is not the dashboard. The value is what you change after reading it: where ad dollars go, which ASINs get content work, which products deserve retention investment, and where pricing is costing you margin.
Amazon positions Brand Analytics as a Brand Registry benefit built from aggregated shopper search and purchase behavior inside Seller Central. This is not scraped third-party data. It is Amazon’s own record of how customers searched, clicked, and bought. If you care about Amazon listing optimization and profit, that distinction changes how much weight you should give these reports.
This guide is not a walkthrough of every tab in the interface. It is not a deep-dive into Search Query Performance hacks or product research workflows; those live in Adverio’s Search Query Performance guide. What this guide builds is the monthly operating cadence that turns five reports into assigned financial decisions. That is the part most teams skip entirely.
If your team checks Brand Analytics only after revenue slips, the tool is not the problem. Your reporting cadence is. Brands that win on Amazon review these reports before they shift budget, expand a catalog, or touch pricing. If you want a second set of eyes on where your data is leaking profit, book a Profit ROI Forecast, and we will pressure-test it for you.
Why Most Brands Let Brand Analytics Collect Dust
Most 7 and 8 figure brands do not ignore Brand Analytics because it is hard. They ignore it because nobody owns it. The dashboard is there. Access exists. The process does not.
That gap is expensive. Every month without a Brand Analytics review is another month where budget gets pushed into the wrong search terms, the wrong ASINs get creative attention, and repeat-purchase products get treated the same as one-and-done products.
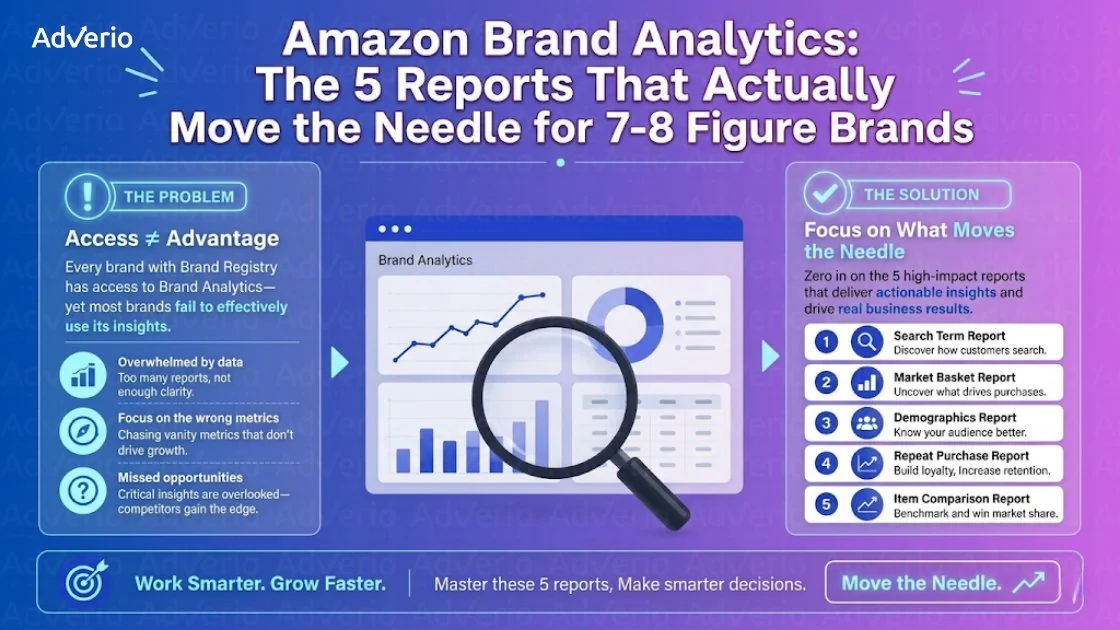
The usual excuse is data scarcity. Smaller brands open Search Query Performance, see gaps, and assume the data is broken or performance is awful. Wrong read. Amazon’s report has reporting thresholds, so smaller or newer brands will see missing query-level data. Pool wider time periods and combine Brand Analytics with PPC search term reports instead of overreacting to sparse coverage.
Missing data is not the same as bad data. On Amazon, it often means your view is too narrow.
The brands that win assign each report to one planning decision. Search data informs keyword and listing priorities. Repeat behavior informs acquisition tolerance. Basket data informs bundles and cross-sell. Demographics informs creative and positioning. That is how raw reporting becomes process. If you want a wider system around this, start with Adverio’s Amazon BI strategy.
The 5 Brand Analytics Reports and the Decision Each One Drives
Most brands treat Brand Analytics like a reference library. That is the wrong use case. Each report should be assigned to exactly one financial decision: where to put ad dollars, which ASINs deserve catalog support, or how aggressively to price and position each product.
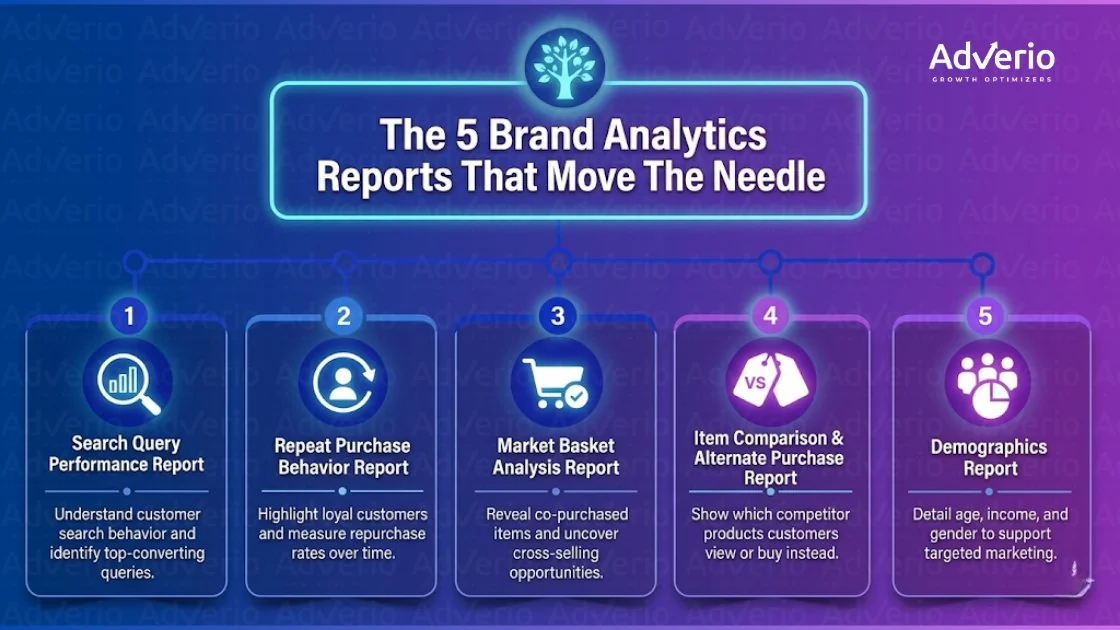
Skip the reports that do not change action. Focus on the five that affect profit.
Report 1: Search Query Performance
Search Query Performance is the first Amazon Brand Analytics report to review because it shows where demand exists and where your brand fails to convert that demand into clicks and orders.
It is more useful than a keyword dump. Query-level performance shows which search terms create visibility, which ASINs win the click, and where your product page or offer breaks. That is how you separate traffic problems from retail problems.
Use it to make three calls:
-
Find wasted visibility: If you earn impressions on non-branded terms but lose click share, fix image stack, title relevance, and keyword-to-ASIN alignment.
-
Catch branded leakage: If your own branded queries send clicks or purchases to competitors, clean up defensive campaigns, pricing, and listing relevance immediately.
-
Identify offer failure: If click share holds but purchase share falls, the issue is conversion. Price, reviews, couponing, and content need work.
Your keyword strategy for Amazon should be built from this report, not from search term exports alone. Search Query Performance tells you which themes deserve manual exact campaigns, which ASINs need retail readiness fixes, and which search intents belong in listing copy.
Decision it drives: shift budget into high-intent non-branded queries where demand is proven, then separate branded defense from prospecting so you stop mixing two different jobs in one campaign structure. This is the foundation of any serious Amazon PPC management approach.
Report 2: Repeat Purchase Behavior
This Amazon Brand Analytics report decides which ASINs can support aggressive acquisition and which ones cannot.
Brands often apply one CAC target across the catalog. That is lazy math. A replenishable product can justify a higher acquisition cost than a product bought once every year or two. If you ignore that difference, you either overspend on weak products or starve the products that can compound margin over time.
Review Repeat Purchase Behavior with one goal. Sort your catalog into products that earn the right to buy customers and products that need strict efficiency.
| Question | What to check | What to do |
|---|---|---|
| Which ASINs create durable value? | Repeat customer patterns by product | Raise acquisition tolerance on stronger repeat products |
| Which ASINs need retention support? | Products with visible repurchase behavior | Push Subscribe and Save, post-purchase education, and replenishment timing |
| Which ASINs should stay out of prospecting? | Weak repeat signals | Keep bids tighter and protect contribution margin |
This report pairs well with Amazon customer lifetime value analysis. You do not need a complex model to act on it. You need a clear rule for which products deserve more spend.
Decision it drives: increase acquisition tolerance only on ASINs with repeat behavior strong enough to pay back that spend.
Report 3: New to Brand Metrics
Many ad accounts look efficient because they are intercepting shoppers who were already likely to buy. That inflates confidence and hides stagnant customer growth.
New to Brand metrics separate customer acquisition from demand capture. If non-branded campaigns produce sales but weak new-to-brand rates, your account is not expanding the customer base. It is paying for shoppers already close to conversion.
Tie this report to your Amazon incrementality measurement. Without that filter, teams scale campaigns that raise revenue while adding very few new buyers.
Use the report to judge campaign intent:
-
High NTB on a prospecting ASIN: support broader reach and accept a higher CPC if margin can handle it.
-
Low NTB on non-branded campaigns: tighten targeting, clean up campaign segmentation, and stop calling recapture acquisition.
-
Low NTB on branded campaigns: acceptable. Those campaigns exist to protect and convert existing intent.
Pull New to Brand before any budget expansion conversation. If prospecting spend is not bringing in new buyers, the answer is campaign restructuring, not more budget.
Decision it drives: reserve scale for campaigns that acquire new customers, and rebuild non-branded structures that are just harvesting demand. For brands ready to push net-new acquisition beyond search, layer in Amazon DSP management to reach shoppers who have not searched yet.
Report 4: Market Basket Analysis
Market Basket Analysis answers a simple merchandising question. What do customers already buy together, and have you built your catalog and media around that behavior?
Too many teams treat this report like trivia. That leaves money on the table. Basket data should shape bundle creation, product targeting, storefront layout, and cross-sell sequencing.
Use it in four practical ways:
-
Bundle planning: Test virtual bundles around products that appear together consistently.
-
Product targeting: Build Sponsored Products targeting against complementary ASINs with proven co-purchase behavior.
-
Storefront sequencing: Place paired products next to each other in modules, comparison charts, and collection pages.
-
Post-purchase cross-sell: Reinforce logical add-ons after purchase where compliant and relevant.
Internal opinions produce weak bundles. Shared-order behavior produces stronger ones.
Decision it drives: prioritize cross-sell campaigns, bundles, and merchandising around product pairings customers already validate with real orders.
Report 5: Demographics
The Demographics report inside Amazon Brand Analytics keeps your positioning honest.
A surprising number of brands still write content for the customer they pitched in the annual plan, not the customer who is buying today. That gap shows up in flat conversion, weak creative response, and pricing that misses the buyer’s expectations.
Use this report to make three decisions:
-
Validate your ICP: If the buyer profile differs from internal assumptions, update copy, images, and benefit hierarchy.
-
Adjust pricing posture: If the current buyer base skews more price-sensitive or more premium than expected, your offer strategy needs to match.
-
Refine creative direction: Align image style, claims, and merchandising with the audience that converts.
Mature catalogs benefit most from this review because positioning drift happens slowly. A product can win with a different audience than the one the brand first targeted. If that shift is visible in demographics, your creative should reflect it.
Decision it drives: rewrite positioning, creative, and pricing posture around the customer segments that are buying now.
The Monthly Brand Analytics Review: A 60-Minute Operating Cadence
Amazon Brand Analytics does not fail because the reports are weak. It fails because brand teams treat it like reference material instead of an operating review. The fix is simple: put it on the calendar every month, keep the meeting to 60 minutes, and force every report into a financial decision.
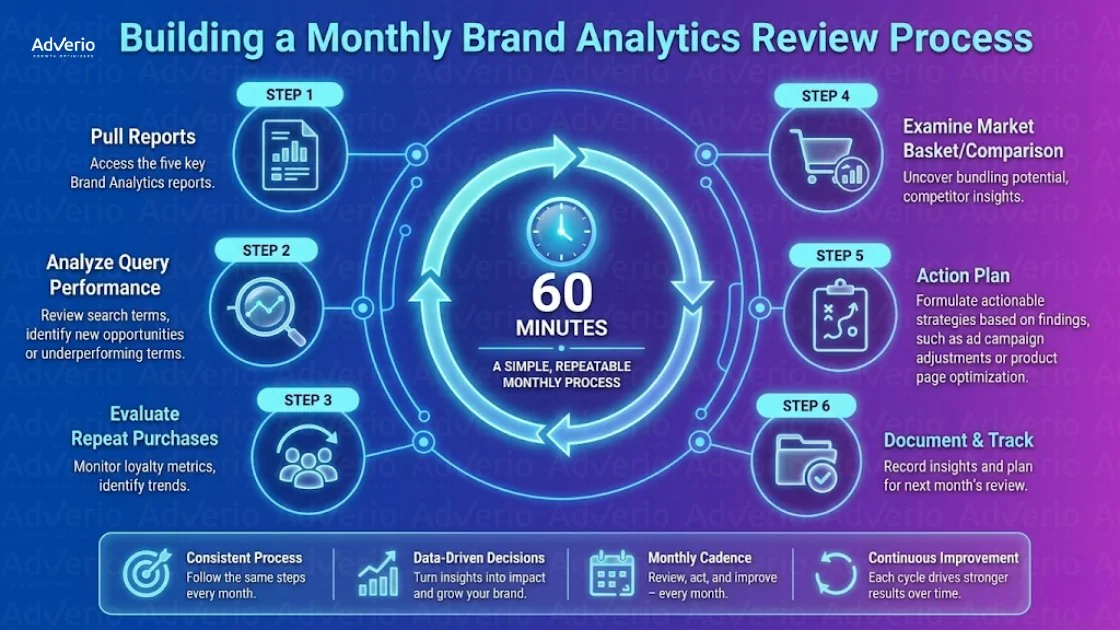
Use the same sequence every time so the review turns into a repeatable management system instead of a loose discussion.
-
Search Query Performance: Start with demand and efficiency. Flag queries where impressions are strong but clicks lag, or clicks are healthy but purchases stall. Those gaps decide where to cut waste, where to fix PDP conversion, and where to push more spend.
-
Repeat Purchase Behavior: Review retention next. Mark ASINs with enough reorder strength to justify heavier customer acquisition and identify weak-repeat products that need margin protection, not scaled traffic.
-
New to Brand: Separate true customer acquisition from branded recapture. Teams usually overstate growth and overspend on campaigns that look efficient but add little incremental revenue.
-
Market Basket Analysis: Pull out product pairings that deserve bundle tests, product targeting, and storefront placement. Shared-order behavior should decide merchandising priorities, not internal guesses.
-
Demographics: End with buyer fit. If the customer profile has shifted, update the messaging, image stack, and pricing posture before performance slips further.
Document three things for each report:
-
What changed
-
What decision it triggers
-
Who owns the follow-through
That one-page brief should drive next month’s budget shifts, listing updates, and catalog decisions. If the review ends with observations instead of assigned actions, the process is broken.
For teams that want tighter scorecards around this cadence, Adverio’s Amazon profit KPIs guide is a useful reference for tying Brand Analytics to profit metrics rather than vanity reporting.
How Adverio Operationalizes Brand Analytics for Profit
Brands do not need more dashboards. They need one operating rhythm that turns Brand Analytics into budget moves, listing changes, and catalog decisions, with an owner attached to each.
Inside Adverio account management, Amazon Brand Analytics gets reviewed alongside contribution margin, TACoS, inventory position, and pricing pressure. That keeps search demand, repeat behavior, and product-level performance tied to the same profit discussion instead of getting buried in a separate report. Teams that want outside execution support can work with Adverio on Amazon account management with a model built around those exact decisions.
The practical standard is simple. Query shifts trigger spend reallocation. Repeat purchase patterns trigger retention or bundle actions. Basket and catalog signals trigger merchandising changes. If a report does not end in a task, due date, and owner, it stays noise.
Adverio applies that process inside weekly execution and monthly business reviews so Brand Analytics affects profit, not just reporting. If you want a clearer view of what that can mean for your account, book your Profit ROI Forecast.
Frequently Asked Questions About Brand Analytics
What is the minimum sales velocity needed for Brand Analytics to be useful?
There is not a universal number. The practical issue is reporting thresholds. Some reports, especially query-level views, will not surface complete data for lower-volume brands or newer ASINs. When that happens, widen the date range and combine Brand Analytics with PPC search term data. Sparse coverage does not mean the product is failing.
How is Brand Analytics different from Seller Central search term reports?
Seller Central search term reports are ad-reporting tools. Brand Analytics is broader buyer-intent and purchase-behavior intelligence from Amazon’s own aggregated search and purchase data. Use ad reports to manage campaigns. Use Brand Analytics to decide what campaigns, listings, and catalog actions should happen in the first place.
Can I use Brand Analytics to track competitors directly?
Not in the way some teams expect. Brand Analytics is better for competitor adjacency than direct surveillance. Search Query Performance helps you see which ASINs win clicks and purchases around important queries. That is enough to identify who sits next to you in demand, where your branded terms face pressure, and where your offer loses the click.
How should I use Brand Analytics for a new product launch with limited data?
Do not force precision too early. Use wider date windows where possible, borrow lessons from adjacent ASINs in your catalog, and combine Brand Analytics with launch ad data. For new launches, the mistake is treating low-volume visibility gaps as verdicts. Early on, you need directional intelligence and disciplined testing, not false certainty. For broader operating context, review Adverio’s Amazon brand management guide.
If your Brand Analytics workflow still depends on someone remembering to check a dashboard, you do not have a strategy. You have hope. Adverio helps established marketplace brands turn Amazon’s native data into decisions on spend, listings, retention, and catalog focus. Book your Profit ROI Forecast and see where profit is getting left behind.