Have a Question? Call Us at +1 (415) 741-5609 to Speak with a Marketplace Expert Today
Business Intelligence
Adverio’s ecommerce business intelligence system connects fragmented business data across Amazon, Walmart, and Target into one governed decision layer.


Amazon's advertising revenue reached $56.2 billion in 2024, growing 18% year-over-year, according to Amazon's Q4 2024 earnings report. At that scale, the difference between governed and ungoverned spend allocation is measured in seven figures.


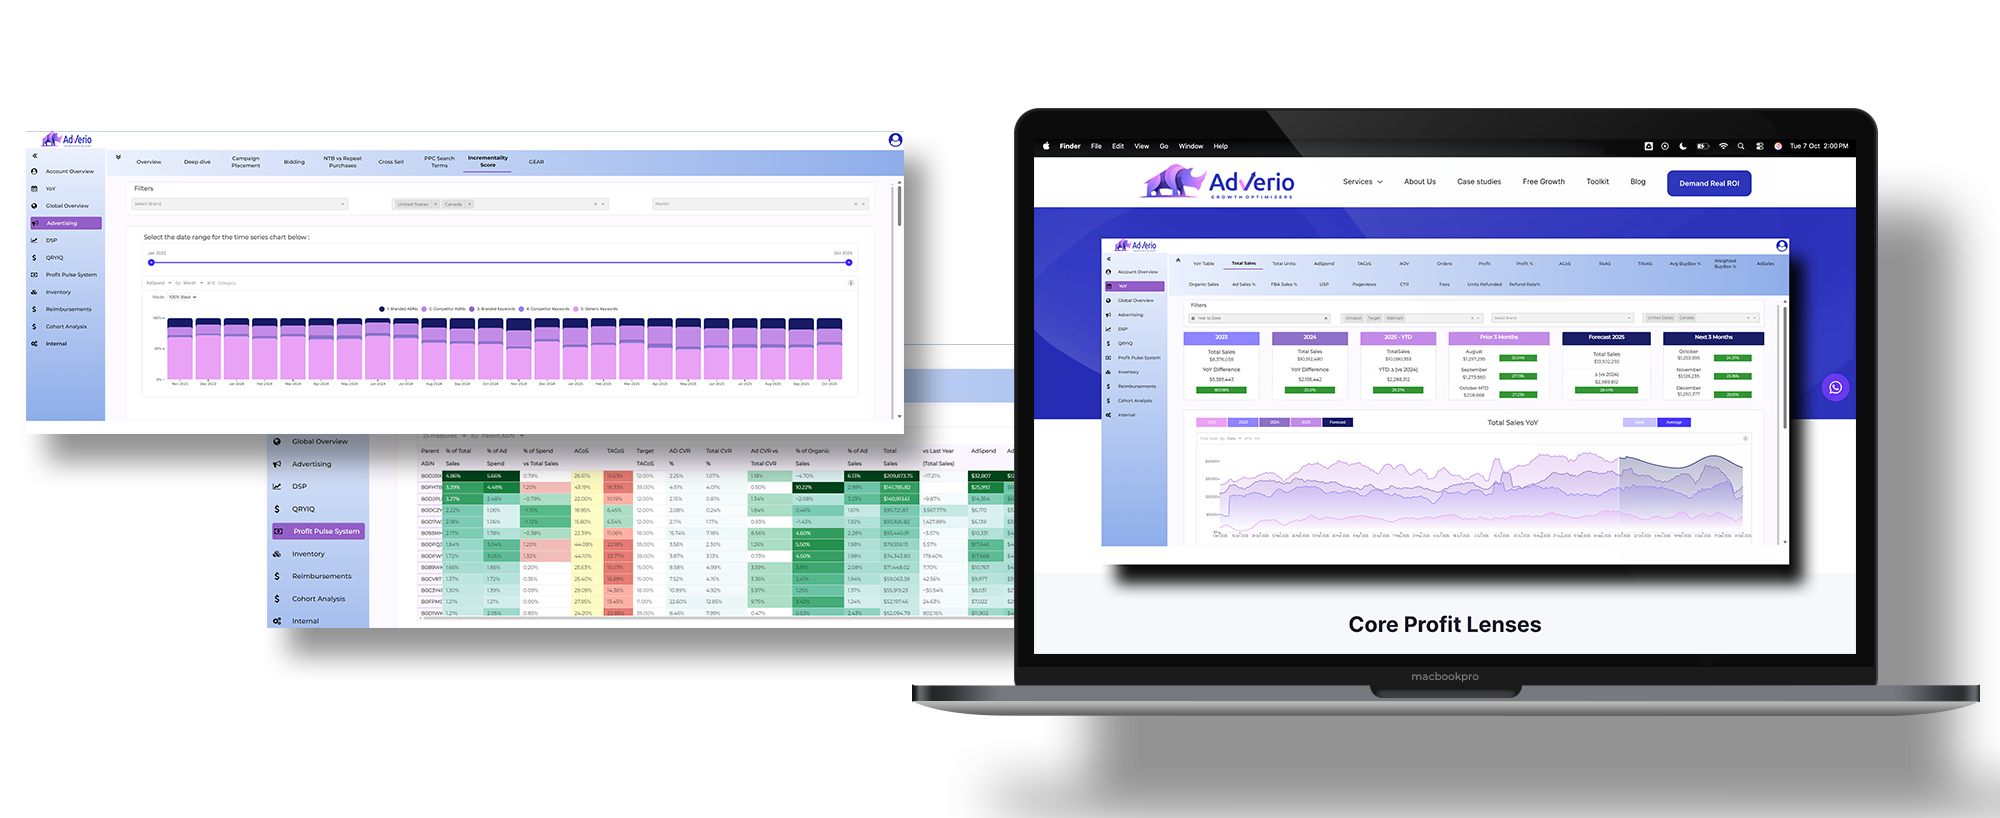
We model incrementality—not just clicks and ROAS.
Clear Do / Don’t callouts by SKU, query, and channel.
Every chart ties to execution across Amazon PPC management, content, and pricing.
Separates net-new revenue from revenue you would have captured anyway.
Branded ROAS can look healthy while generics quietly erode and margin compresses.
Reallocate protected spend into generics that expand reach without spiking TACoS. Then reinforce with conversion-ready PDPs supported by Amazon listing optimization services.
A composite KPI that identifies where your next dollar increases contribution margin—not just revenue.
Revenue growth without margin growth is false scale.
Route budget only to SKUs and queries showing positive GEAR delta across Amazon and emerging channels like Walmart PPC management.
Organic rank + impression share by branded, generic, and competitor query class.
Category leaders know when to push and when to hold.
Only scale where PDP readiness, rank velocity, and conversion strength align—including structured expansion into Target PPC management.
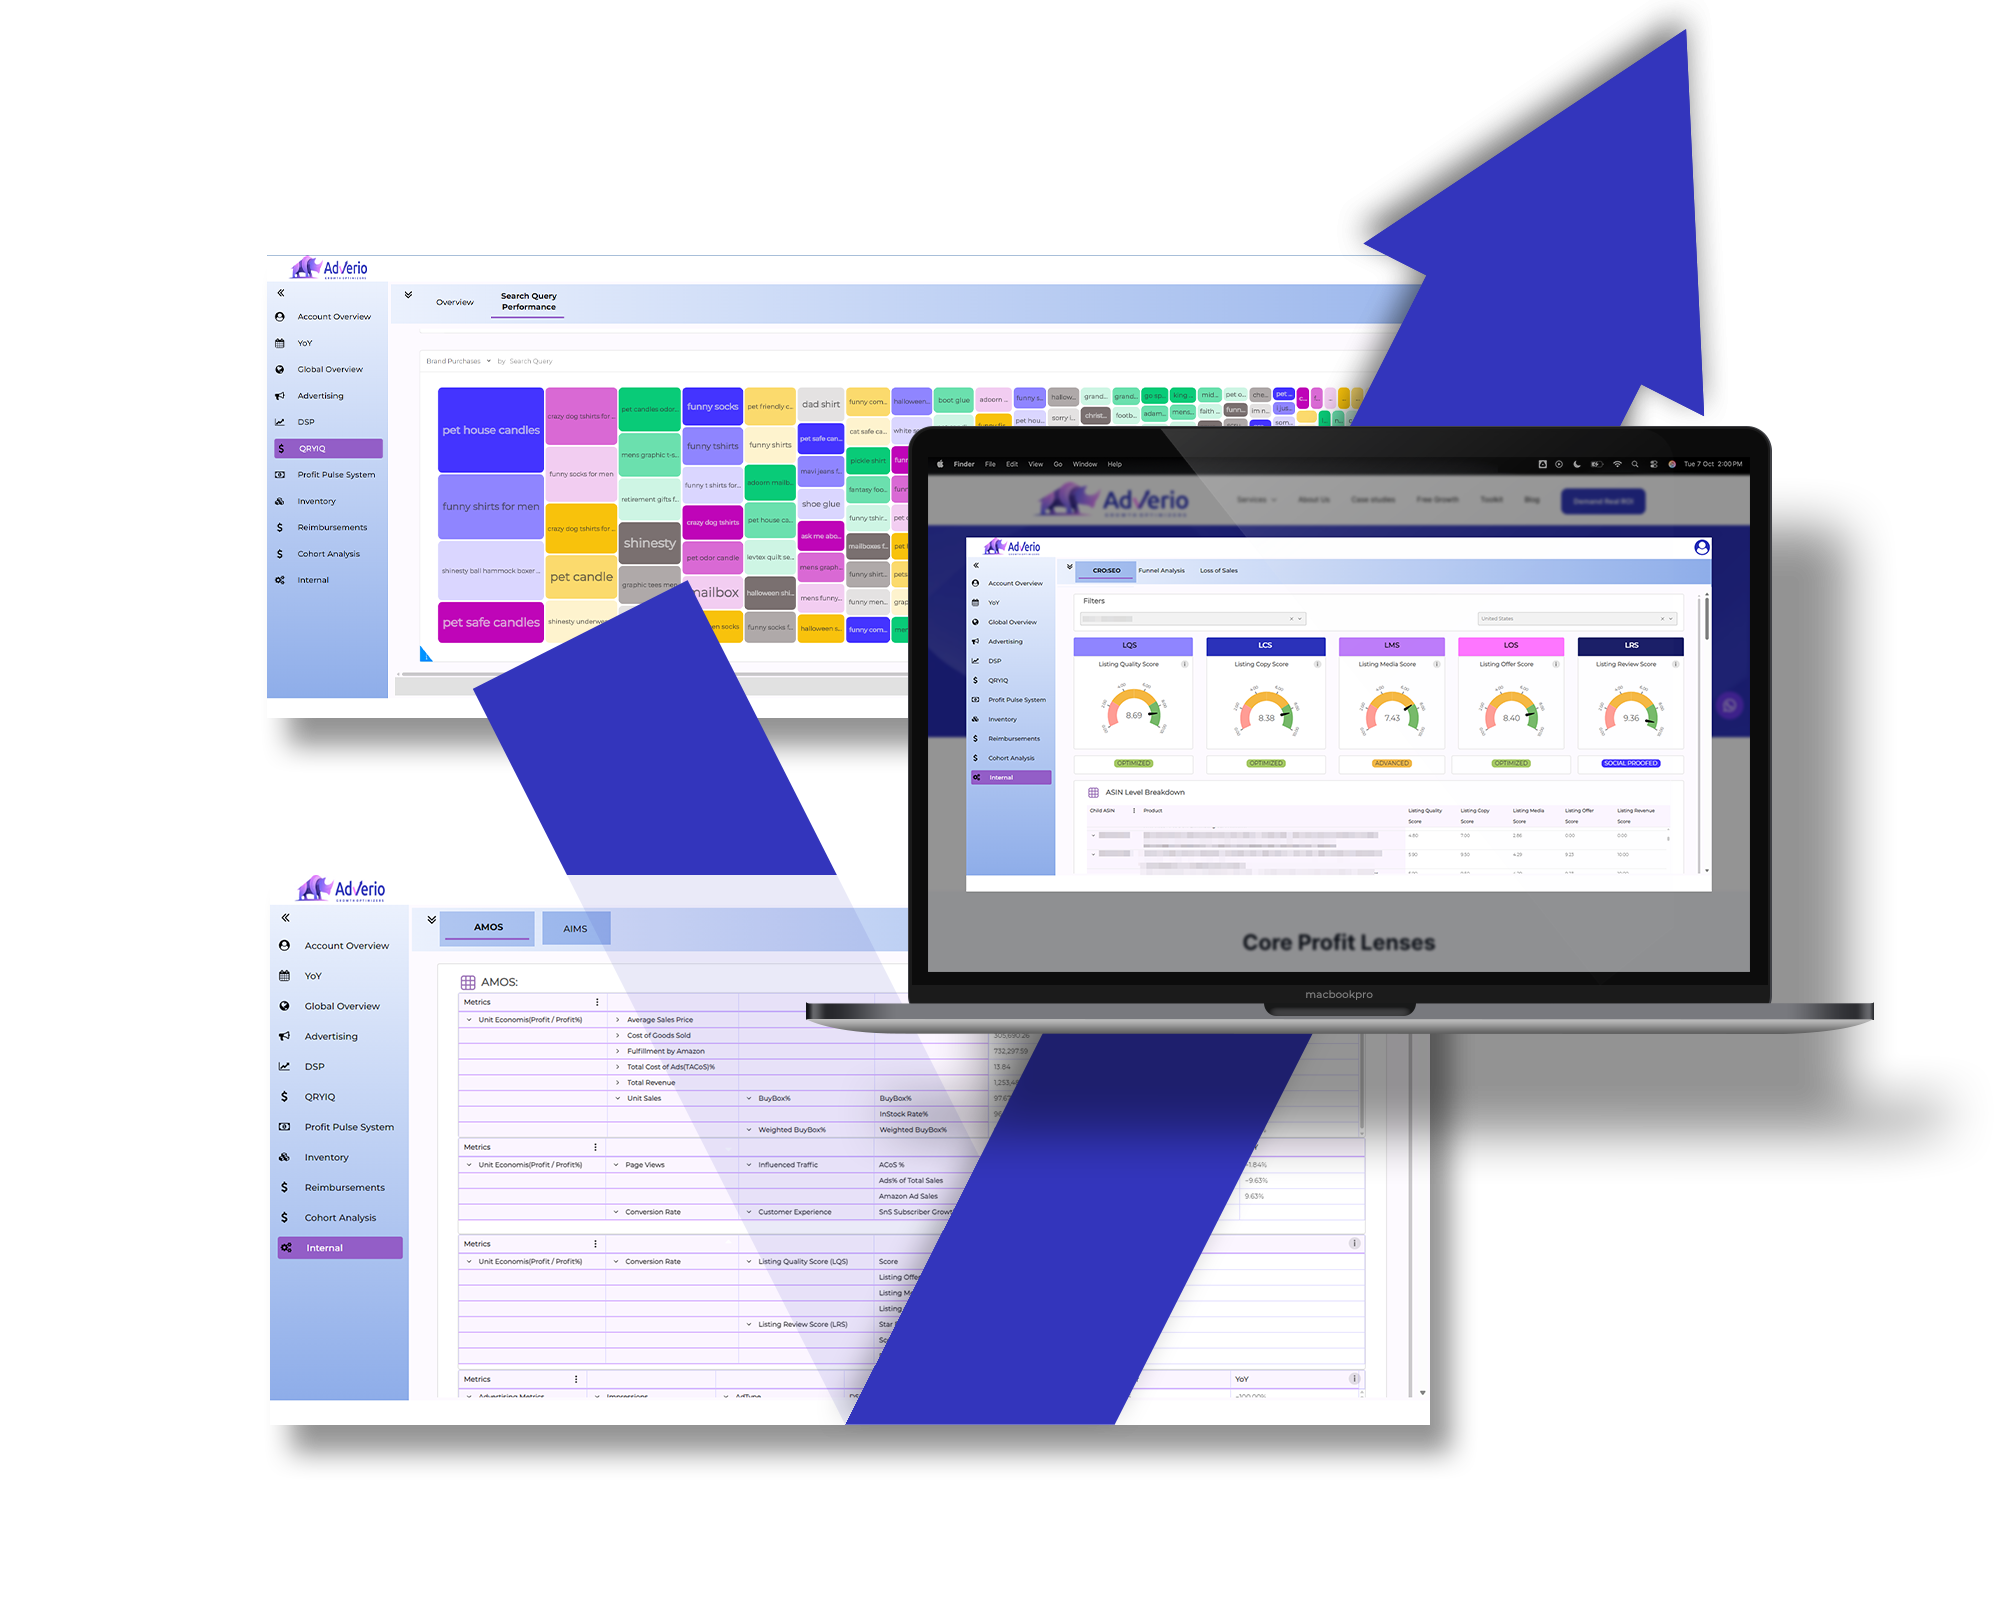
Five conversion dials—Quality, Copy, Media, Offer, Reviews—with status tags and next actions.
Traffic cannot fix broken product pages.
Fix the top three blockers per PDP before scaling ads. Conversion-first discipline compounds faster than brute-force spend.
Daily Buy Box %, volatility flags, and price-elasticity versus conversion modeling.
Promoting a volatile Buy Box destroys efficiency and erodes margin.
Anchor spend only to stable ownership and proven price bands.
Live P&L by SKU and collection blending ad cost, marketplace fees, returns, freight, and promo impact.
Operators need CFO-grade clarity before allocating capital.
Kill or fix profit-leaking SKUs before scaling traffic.
Amazon sellers spent an average of 14.7% of their total revenue on advertising in 2025, up from 11.2% in 2022, according to Marketplace Pulse's 2025 seller economics analysis. Without incrementality modeling, a significant portion of that spend is defending sales you'd win organically.
Connect ad, retail, catalog, pricing, and review data into one governed dataset.
We normalize, score, and surface Do / Don’t plays with guardrails.
We launch structured tests across ads, listings, and pricing—and track lift against Incrementality and GEAR.
Either way, you win: keep your team, or let us execute. We’re built for both.
The average brand managed retail media campaigns across 4.2 separate platforms in 2025, per the Retail Media IQ Annual Report (2025). Fragmented reporting across three platforms without a unified BI layer means every decision is made on incomplete data.
Branded spend = 62%. Generic rank is sliding.
Reallocate 20% to top-five generics where CRO:SEO ≥ 8 and Buy Box stability is confirmed.
Pause if TACoS > +2 pts or CVR < –10%.
Incremental sales, rank movement, and GEAR lift inside 21–30 days.
Dashboards + monthly playbook review.
Built for teams that execute internally but want strategic oversight and prioritization clarity.
We implement ad reallocations, CRO changes, pricing adjustments, and iterate weekly—reporting lift tied directly to Incrementality and margin impact.
Product Category: Softlines > Home & Kitchen > Bedding
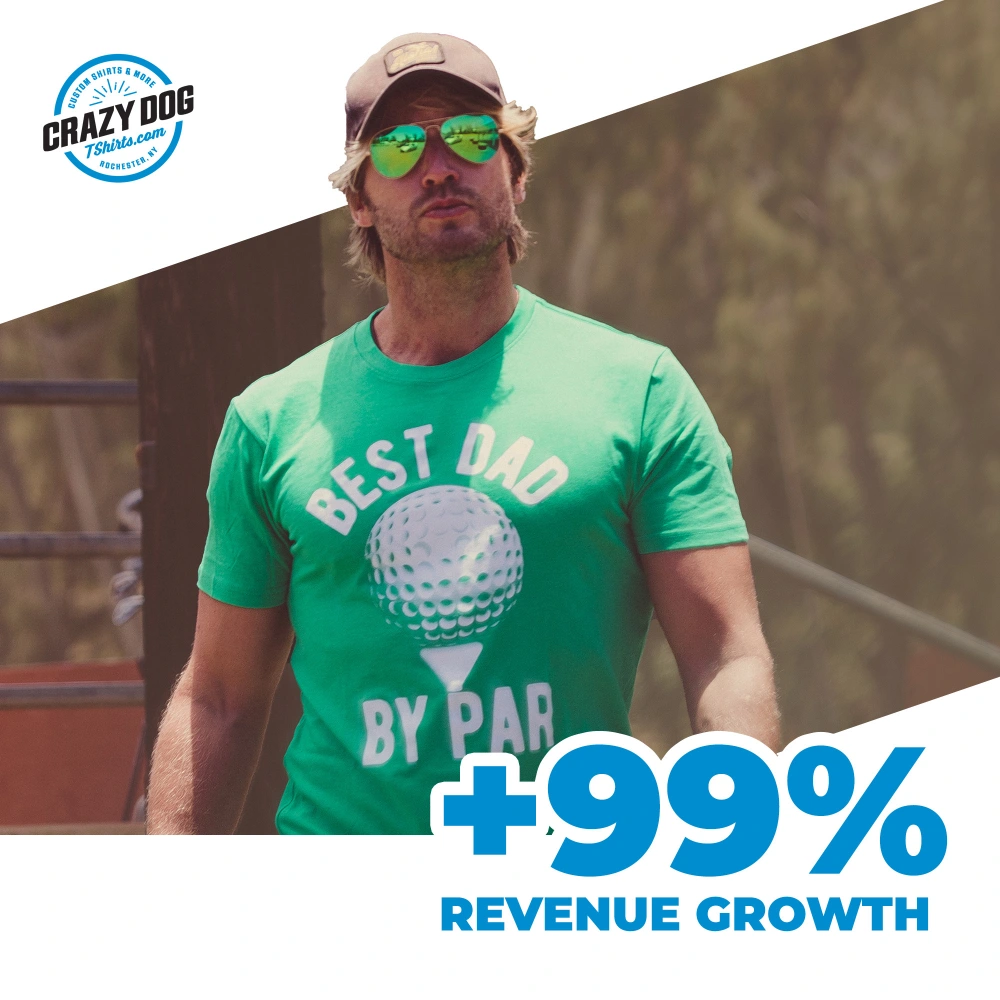
Product Category: Softlines > Apparel > Novelty Tees
Explore Case Study
Ecommerce business intelligence connects fragmented marketplace data, advertising metrics, catalog performance, and pricing signals into one decision layer. Most brands have the data. What they lack is a system that tells them what to do with it. If your reporting shows you what happened last month but cannot tell you which SKU to fix tomorrow, you do not have intelligence. You have a scoreboard.
Dashboards visualize activity. We model incrementality, contribution margin, and capital allocation impact.
Those are visualization tools. We provide ecommerce intelligence consulting layered onto your data to drive deployment and measurable results.
Ad platforms, retail analytics, catalog data, pricing history, and return data. We normalize and operationalize it.
Directional shifts appear within 15–30 days. Measurable compounding lift builds across 60–90 days.
Yes. The framework normalizes cross-marketplace ecommerce data into one decision layer.
If your team debates what to do next every week, your business intelligence isn’t intelligence.
It’s noise. See where your next dollar wins.