



Table of Contents
The case for unified omnichannel reporting has been made. The part most brands still do not have is the actual build.
This guide covers the five components of a finance-grade omni-channel P&L, the step-by-step construction sequence, a working template, and the incrementality adjustment that separates real margin from platform fiction. If you need the strategic case for why siloed reporting fails, that is covered in depth in the hidden costs of split marketplace management guide. What follows here is the model itself.
Want a finance-grade view of where your channels actually make money before you reallocate another dollar of budget?
Get My Profit ROI Forecast. 15-minute call. No pitch deck.
The Omni-Channel Profit Model At a Glance
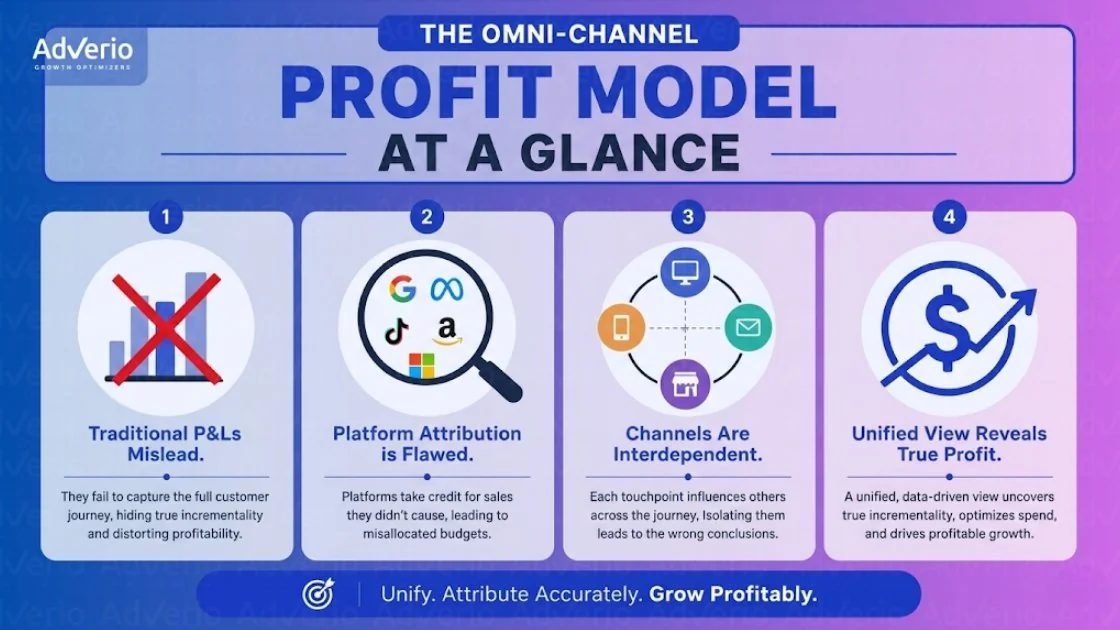
The usual omni-channel conversation is too small. It obsesses over attribution cleanup when the essential job is capital allocation.
An omni channel profit model gives you one financial view across Amazon, Walmart, and Target based on cash collected, fully loaded channel costs, shared overhead, and the sales each marketplace creates or steals from another. That is the standard. Anything less is channel theater.
Here is what matters:
-
Separate channel reporting hides the actual economic answer. A marketplace can post strong in-platform efficiency while destroying blended margin through fees, returns, discounts, and fulfillment drag.
-
Attribution cleanup is not enough. You also need settlement data, contribution margin by order, and adjustments for incrementality and cannibalization. Brands solving data mismatch with server-side tracking still need a finance model that ties back to cash.
-
Marketplace performance is connected. Pricing moves, stockouts, ad pressure, and review momentum on one channel change demand on the others. If you want the competitive setup across retail media and marketplaces, review Amazon vs Walmart vs Target.
-
The model exists to direct budget, not decorate dashboards. It shows where the next dollar produces real contribution after channel-specific costs and shared operating expense.
-
Bad models waste money fast. You keep funding channels that win reports and lose cash.
A brand does not need three flattering scorecards. It needs one P&L that shows which channel deserves more inventory, more media, and more working capital.
Why Three Separate P&Ls Always Lie
Three separate P&Ls create three distortions that compound into bad capital allocation. Understanding each one determines how you build the corrective model. The first distortion is duplicate credit. Channel teams stack attribution claims on top of one order. That stack is not growing.
It is overlapping storytelling that makes every budget request look justified. The second distortion is timing mismatch. Marketplaces use different attribution windows, return timing, fee structures, and settlement schedules. A channel can look profitable inside its own reporting period, while the cash shows up late, the return hits next month, and the fee true-up wipes out the gain.
The third distortion is cost omission. Separate P&Ls rarely carry the full burden of shared overhead, inventory drag, discount pressure, or the demand one marketplace pulls from another. That omission is where the model needs to do the most work.
What bad P&L structure makes you do
Siloed reporting pushes smart operators into dumb decisions:
-
Fund channels that claim influence instead of producing contribution
-
Protect teams that hit platform KPIs while blended margin deteriorates
-
Expand into new marketplaces before the current mix earns its cost of capital
-
Miss cannibalization because each report stops at the channel border
This is not a reporting problem alone. It is a finance discipline problem. Brands spend months fixing tracking infrastructure and still make budget calls from channel views that never tie back to cash.
The operational side usually looks just as fractured. Different owners, different agencies, different dashboards, different definitions of success. The result is familiar if you have seen the issues covered in Adverio on marketplace management issues.
A marketplace does not deserve more budget because it can produce a flattering report. It deserves more budget if, after returns, fees, fulfillment, media, overhead, and cross-channel effects, it increases total company contribution.
Three separate marketplace scorecards do not create visibility. They create three rationalizations for margin loss.
What an Omni-Channel Profit Model Actually Is
An omni-channel profit model is a single operating P&L for the whole commerce business. It does not care which platform won the attribution argument. It shows where cash is created, where margin is leaking, and which channel deserves more capital.
The model starts with settlement-based revenue, not platform-reported sales claims. It then maps the economic load attached to that revenue: product cost, fulfillment, marketplace fees, returns, media, and shared operating expense. After that, it adjusts channel performance for incrementality and cross-channel cannibalization, because a sale that merely migrates from one marketplace to another is not new profit.
That is the distinction many brands miss. A reporting stack explains activity. A profit model governs allocation.
If your Amazon dashboard says growth, Walmart says efficiency, and finance says blended margin is down, the dashboards are not giving you three perspectives. They are giving you three incomplete truths. The job of the model is to force those truths into one financial view that can survive scrutiny from a CFO.
That unified view also exposes SKU-level distortion. A hero item can look healthy on one marketplace and bleed cash on another once fee structure, shipping profile, and promo dependence are loaded correctly. Brands that stop margin erosion usually do it by changing the underlying economics, not by asking for better channel reporting.
If you want the competitive structure across all three marketplaces before building the finance layer, the Amazon vs Walmart vs Target comparison covers the platform differences in detail.
A real omni-channel profit model answers one question with precision: where should the next dollar go to increase total company contribution? If your current setup cannot answer that, you do not have a profit model. You have channel theater.
The Five Components of a Unified Multi-Marketplace P&L
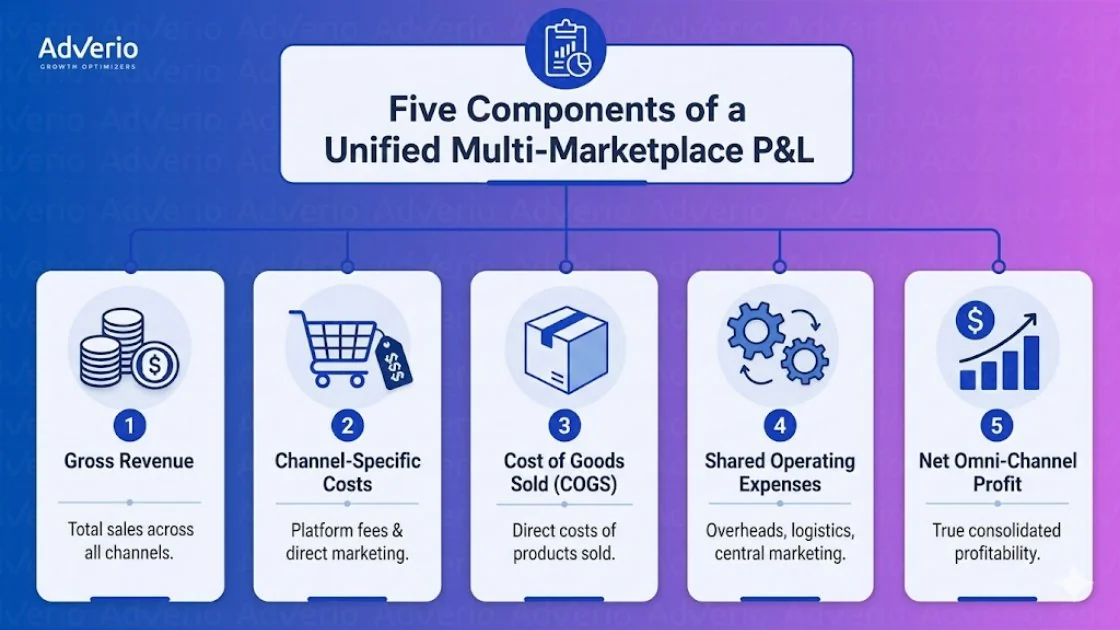
A usable model is not complicated. It is disciplined. These are the five inputs that matter.
Component 1 Gross revenue by channel
Use settlement reports. Not attributed ad revenue. Not vendor dashboards. Not blended exported screenshots from three teams.
Settlement data shows what the platform paid you after deductions tied to the order flow. That makes it the right starting point for a finance-grade model. If your revenue line starts with ad console attribution, every line below it is contaminated.
Strong omnichannel programs retain up to 89% of customers annually versus about 33% for weaker programs, according to Aberdeen Group research. Retention value is real. Platform-reported revenue is still not your P&L input. For settlement-level reporting standards, sellers can reference Amazon’s Seller Central settlement documentation.
Component 2 Channel-specific cost of goods and fulfillment fees
The same SKU can have three very different economics across Amazon, Walmart, and Target.
That means your model needs per-unit cost mapping by channel, including product COGS, inbound freight treatment, fulfillment fees, and platform-specific deductions. If you skip this, you’ll keep scaling products that look healthy on revenue but collapse on contribution.
Brands should also use channel design to stop margin erosion. Different pack sizes, assortment logic, and bundle structure often create cleaner economics and better control across marketplaces.
Component 3 Advertising spend with incrementality adjustment
Do not use platform ROAS as a financial truth source.
Ad platforms measure influence. Finance needs incremental contribution. Those are not the same thing.
A proper omni channel profit model discounts ad-attributed revenue when the campaign is capturing demand that would have converted anyway, or pushing demand from one marketplace to another. This is where a profit-first Amazon PPC management strategy separates incremental spend from demand capture.
Component 4 Shared overhead allocation across channels
Some costs belong to the business, not a single marketplace.
Catalog ops, creative production, agency fees, BI tooling, account management, forecasting support, and compliance work should not disappear because no dashboard owns them. Allocate those costs proportionally and consistently. Revenue share is the cleanest place to start.
Component 5 Contribution margin by channel and total business
This is the only output that deserves executive attention.
Contribution margin is what remains after net revenue, direct costs, incrementality-adjusted ad spend, and allocated overhead. It tells you which marketplace deserves more inventory, more media, more executive focus, or less of all three.
If a channel needs flattering attribution logic to look profitable, it isn’t profitable enough.
The Cross-Channel Cannibalization Problem
Most brands talk about omnichannel upside. Few measure omnichannel displacement.
That blind spot is expensive. Walmart growth can come from true expansion, or it can come from shoppers who would have bought on Amazon anyway. Target media can support demand creation, or it can intercept demand your brand had already earned elsewhere. If you don’t separate those outcomes, you overpay for redistribution.
A real omni channel profit model includes a cannibalization view. The cleanest way to estimate it is through geo-holdout testing or matched-market analysis. The method matters less than the discipline. You need a decision rule for whether a channel created new demand or just claimed existing demand with extra media cost attached.
One pattern shows up often in audits. A brand scales Walmart Connect because reported ROAS looks strong. At the same time, Amazon organic softens in the same category. Revenue appears diversified. Blended contribution margin shrinks. Nothing “failed” in-platform. The total business still got worse.
Adobe’s cited benchmark view captures the upside and the risk in one frame. Omnichannel shoppers spend $1,043 per month versus $659 to $669 for single-channel buyers, according to Grocery Doppio’s State of the Industry: The Omnichannel Grocery Shopper report (2023), conducted with Incisiv and FMI. Without accounting for overlap and cannibalization, brands can over-invest in channels that merely redistribute demand at higher cost.
If your Walmart and Amazon numbers both look strong but blended margin keeps slipping, you are paying twice for the same customer. Get My Profit ROI Forecast. We find the overlap before it eats your quarter.
How to Build the Model in Practice
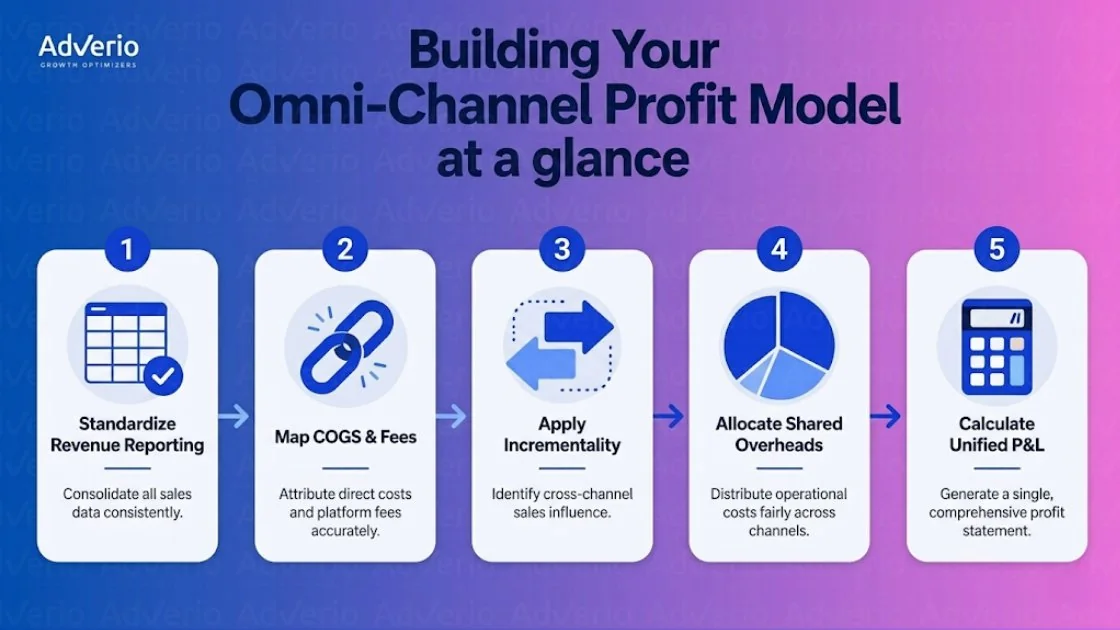
You don’t need a huge tech rebuild to start. You need reporting discipline and a model someone owns.
McKinsey’s view is the right one. Integrated cross-channel data and flexible commerce infrastructure are foundational, and Getting omnichannel personalization right could help companies increase revenue by 5 to 15 percent across the full customer base, according to McKinsey research on omnichannel value.
Step 1 Standardize the revenue reporting layer
Do this. Pull settlement data from Amazon, Walmart, and Target on the same monthly cadence.
Use one calendar, one export logic, and one owner. If one channel reports on order date while another reports on settlement date, fix that first. The model breaks when timing rules drift.
Step 2 Map COGS and fulfillment fees per channel
Do this. Build a per-unit cost sheet for every core SKU and variant.
That sheet should include product cost, freight treatment, fulfillment fees, and other direct marketplace deductions. If your team does not have the internal finance capacity to build this, start with the settlement files from each platform and a single spreadsheet. The model does not need to be sophisticated to be useful.
Step 3 Apply incrementality adjustment to ad spend
Do this. Replace platform-reported efficiency with incrementality-adjusted media cost.
If you have holdout or matched-market data, use it. If you don’t, start with a conservative house assumption and tighten it later. The key is to stop treating all attributed revenue as newly created revenue. That is also where better models tighten marketplace measurement
Step 4 Allocate shared overhead proportionally
Do this. Add up the costs nobody wants to own.
Creative. Catalog operations. Tech stack. Account management. Reporting infrastructure. Compliance support.
Spread them by a consistent rule, usually revenue share to start. Later, you can refine by workload or SKU complexity if needed.
Step 5 Build the unified contribution margin view
Do this. Put each channel on one line in one spreadsheet.
Use columns for gross revenue, returns, net revenue, COGS, fulfillment and platform fees, reported ad spend, incrementality-adjusted ad spend, overhead allocation, and contribution margin in dollars and percent.
Practical rule: The fastest way to start is to stop using platform ad consoles as your P&L. Pull settlement reports from each platform, build gross margin first, then layer in ad adjustments. That single move usually exposes which channel is actually carrying the business.
The Omni-Channel Profit Model Template
Here’s a simple working layout. The figures below are illustrative only. Use your own settlement and cost data.
| Channel | Gross Revenue | Returns & Allowances | Net Revenue | COGS | Fulfillment & Platform Fees | Gross Margin | Ad Spend (Platform Reported) | Incrementality-Adjusted Ad Spend | Allocated Overhead | Contribution Margin ($) | Contribution Margin (%) |
|---|---|---|---|---|---|---|---|---|---|---|---|
| Amazon | Example input | Example input | Example input | Example input | Example input | Example input | Example input | Example input | Example input | Example output | Example output |
| Walmart | Example input | Example input | Example input | Example input | Example input | Example input | Example input | Example input | Example input | Example output | Example output |
| Target | Example input | Example input | Example input | Example input | Example input | Example input | Example input | Example input | Example input | Example output | Example output |
| Total | Sum of channels | Sum of channels | Sum of channels | Sum of channels | Sum of channels | Sum of channels | Sum of channels | Sum of channels | Sum of channels | Sum of channels | Blended output |
Use this as a finance tool, not a reporting decoration. Keep the structure simple enough that leadership trusts it and the channel teams can’t hide behind platform-native narratives.
A bad model with clear ownership beats a “perfect” model that nobody updates.
How Adverio Runs This Model for Clients
Adverio treats this as an operating finance system, not a reporting layer.
For brands that want outside execution, our Amazon growth strategy and DSP management systems plug directly into this P&L structure.
Adverio uses its Profit Pulse Intelligence System to track contribution margin by channel and by SKU or ASIN iinside one shared P&L structure. That forces every marketplace decision back to the same question. Does it improve cash contribution after real costs, overlap effects, and shared operating expense?
That standard changes behavior fast. Channel teams stop defending platform screenshots. Leadership gets one profit view to use for budget shifts, inventory moves, assortment cuts, and media decisions before finance closes the quarter.
This work is blunt by design. If Amazon growth is pulling demand from Walmart, the model has to show it. If paid media is overstated by platform reporting, the model has to correct it. If a channel looks strong on revenue and weak on contribution, capital should move.
Omni-Channel Profit Model FAQs
What if you don’t have reliable incrementality data yet
Build the model anyway.
Waiting for perfect incrementality data is how brands stay trapped in channel fiction. Set a conservative adjustment rule, write down the assumption, and update it as you collect better evidence from holdout tests, matched-market comparisons, or controlled budget changes.
Cross-channel modeling already beats siloed reporting by a wide margin. Industry analytics research suggests these models can forecast customer lifetime value with 70 to 80 percent accuracy. Good finance decisions do not require perfection. They require assumptions that are explicit, reviewable, and grounded in real cash outcomes.
How often should the model be updated
Monthly is the floor.
Quarterly reporting leaves too much time for waste to hide inside media spend, inventory decisions, and marketplace pricing. Weekly updates can work for larger brands with enough volume and operational discipline. For many brands, monthly is the right cadence because it gives you usable signal without turning the process into a data cleanup exercise.
Pick one cadence and enforce it. Same inputs. Same cost rules. Same owner.
Is this only for very large brands
No.
Any brand selling across multiple marketplaces can distort profit if each channel is judged inside its own P&L. The problem starts long before scale. It starts the moment Amazon, Walmart, and Target are allowed to claim revenue without absorbing their real costs and overlap effects.
Smaller brands should start with a stripped-down version. Pull actual revenue. Map direct costs. Adjust media impact conservatively. Allocate shared overhead. Then move capital based on contribution, not platform narratives.
What’s the biggest mistake teams make during setup
They treat ad platform data like financial truth.
Ad consoles are built for campaign optimization. Settlement files, fulfillment charges, returns, trade spend, and shared operating costs are what belong in a profit model. Mix those jobs together and you preserve the exact distortions that caused the problem in the first place.
If your channel dashboards look healthy, but the blended margin keeps slipping, your reporting structure is broken.
Adverio helps brands build finance-grade visibility across Amazon, Walmart, and Target so capital goes to the channels that produce real contribution margin.
Get My Profit ROI Forecast 15-minute diagnostic. We either find the leaks or confirm you are already optimized.
Read Next
-
Hidden costs of split marketplace management: the strategic case for unified reporting