



Conversion rate is the only lever that makes every other dollar in the account cheaper.
If your Amazon sales have plateaued while ad spend climbs, you do not have a traffic problem. You have a conversion problem, and it is costing you more than the lost sales.
Money goes into PPC, DSP and new keywords while the one asset that decides profitability sits unexamined: the product detail page. When listings do not convert, every click gets more expensive, margins shrink, and growth stalls.
Amazon conversion rate optimization is not cosmetic tweaks or keyword stuffing. It is engineering Amazon listings that turn traffic into revenue, and revenue into scalable profit. This guide covers how to find your conversion leaks, which ASINs to fix first, and why the sequence matters more than the tactics.
At a Glance
Table of Contents
Five things to take away
- Your conversion rate sets what every click costs you. Nothing else on the page does that.
- Convert at 20% against a competitor at 10% and you can bid twice as much for the same ACoS.
- Sort by sessions, not by conversion rate. High traffic converting slightly below average costs more than low traffic converting badly.
- Unit Session Percentage is Amazon’s term for conversion rate. Brand Conversion Share is how you compare against competitors on the same query.
- Fix conversion last and you fund your competitor’s bid advantage in the meantime.
Quick Answer
Amazon conversion rate optimization is the work of raising the percentage of product page visitors who buy. It matters more than any other lever because conversion rate sets your effective cost per click, your organic rank and your retargeting economics at the same time. Start by finding your highest-traffic, lowest-converting ASINs in Business Reports, confirm the listing is the problem using Search Query Performance, then fix visuals, copy, social proof and offer in that order. Do it before you scale spend, because scaling spend against a page that does not convert makes the problem more expensive rather than smaller.
Definition
Conversion rate is the share of product page visitors who buy.
Unit Session Percentage is Amazon’s term for it, found in Business Reports at parent level. Units purchased per 100 sessions.
Brand Conversion Share sits in Search Query Performance and does something different. It compares your conversion rate on a specific search term against the top competitors on that same term.
The first two are the same measure. The third is the one that tells you whether the listing is the problem or the traffic is, and it is the most underused report on Amazon.
|
BEFORE THE NEXT BUDGET You approved more ad spend because sales were flat. Your competitor can outbid you on half the budget and pay less for it.
15 minutes. Bring your Business Reports export. |
1. Why conversion rate is your bid ceiling
Most CRO guides treat conversion rate as a cosmetic problem.
Your conversion rate decides what you are allowed to pay for a click.
Convert at 20% while a competitor converts at 10%, and you can bid twice as much for the same click and still land on the same ACoS. Their ceiling is half of yours on identical economics.
That is not a benefit of CRO. It is the argument.
Conversion rate is the only variable that moves three things at once. It lowers your effective cost per click, because you need fewer clicks per sale. It lifts organic rank, because Amazon reads conversion as relevance. And it turns retargeting from waste into return, because the traffic you recover lands somewhere that closes.
The consequence is rarely stated plainly. A brand that fixes conversion last is funding its competitor’s bid advantage in the meantime. Every month spent optimizing bids against a page that does not convert is a month the better-converting competitor outbids you on the same budget and pays less for the privilege.
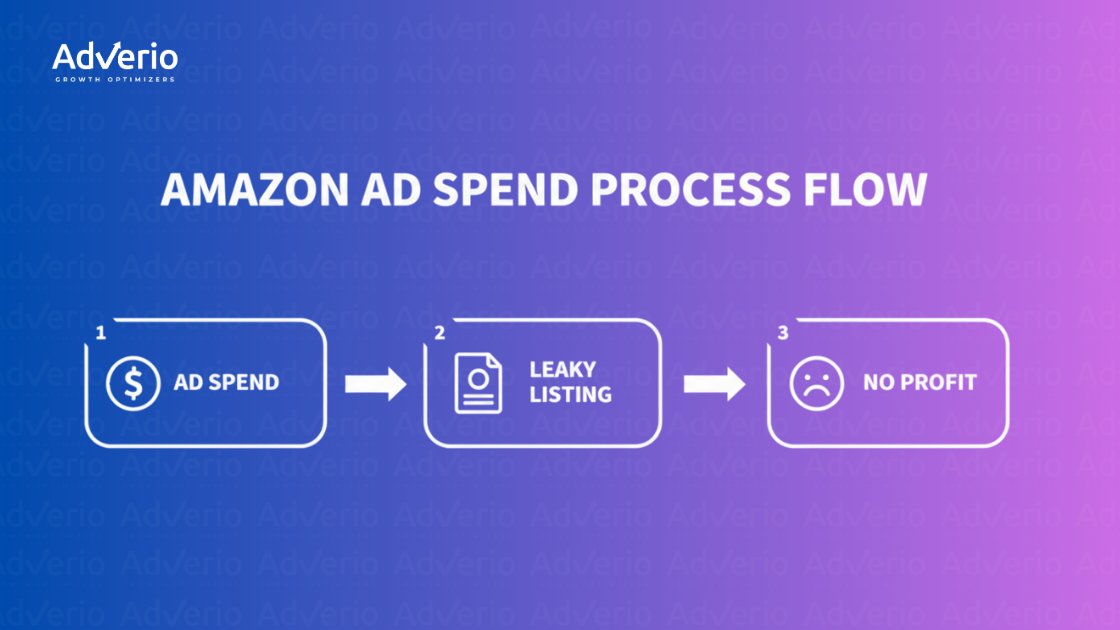
The most expensive click you can buy on Amazon is the one that does not convert. It wastes the ad spend and tells the algorithm your product is less relevant, which costs you organic rank on top.
Brands get stuck in Optimization Myopia, tuning ACoS and CPC while the product page quietly bleeds profit. The page is where the money is decided. Everything upstream of it is just traffic acquisition, and traffic acquisition against a leaky page is the most expensive habit in the account.
See how our Amazon Listing Optimization Services turn product pages into profit engines.
What to do
- Calculate your bid ceiling before your next budget meeting. Your CVR against your category’s, at your target ACoS.
- Read CVR and CPC as one number. A conversion gain and a cost drop are the same event measured twice.
- Sequence conversion before spend. The returns run one direction, and it is not the direction most plans assume.
What to avoid
- Judging CRO on sales lift alone. The cheaper clicks are half the return and they show up in a different report.
- Scaling spend on an ASIN you know converts below category norm. You are buying the problem at volume.


2. Finding the leaks: a data-driven diagnosis
Before you rewrite a bullet or swap a hero image, find out exactly where the funnel fails. This is forensic analysis of your own performance data, not guesswork.
Tracking overall conversion rate leaves you blind. That number will not tell you where the money is going. You need ASIN-level diagnosis to separate the growth engines from the dead weight.
Your diagnostic toolkit
Business Reports. The “Detail Page Sales and Traffic By Parent Item” report gives you Unit Session Percentage for every product. That is your conversion rate, and it is the clearest indicator of listing health.
Search Query Performance. The most underused data source on Amazon. It shows the terms driving traffic, and it shows your conversion rate on those terms against the category’s top competitors. That comparison is what turns a suspicion into evidence. Here is how to build a profit-driven Amazon business intelligence system around it.
Reading the data
Sort by sessions. Your highest-traffic ASINs with the lowest Unit Session Percentage are your biggest liabilities, and they are where the money is.
Fixing a product that gets 5,000 sessions a month and converts at 5% moves more money than optimizing one with 50 sessions converting at 2%. Go after the biggest leaks first.
Three to five ASINs usually account for the majority of conversion drag in a catalog. Fixing those before touching spend is the move that compounds.
Then cross-reference against Search Query Performance. If competitors convert at two or three times your rate on your most important keywords, that is your evidence. Demand exists. The offer is failing to connect.
That process is the foundation of our Listing Quality Score (LQS), which prioritizes which ASINs to fix and in what order, so the sequence follows the money rather than opinion. Making sense of that data is a core function of our customized business intelligence dashboards.
Key Amazon CRO diagnostic metrics
What to do
- Pull Business Reports at parent level, not child. Child-level noise hides the pattern.
- Set a baseline before you change anything. Conversion rate and sessions, both recorded, so the read afterwards means something.
- Check click share and conversion share together. They point at different fixes.
What to avoid
-
- Starting with low-traffic, low-conversion listings because the percentage looks worse. The percentage is not the money.
- Treating overall account conversion rate as a diagnosis. It is a symptom reading.
|
+1,119%
Profit Growth
Levtex Home
 |
+586%
Profit Growth
Karat
 |
+833%
Revenue Growth
Crazy Dog
 |
3. Building a product page that converts
Your product page is the difference between profitable scale and wasted ad spend. Getting it right is engineering rather than decoration.
Product pages get treated as a jumble of mediocre images, keyword-stuffed bullets and a price tag. That erodes margin directly. To win, rebuild the page around one job: turn browsers into buyers.
Visual merchandising that sells
Visuals are your primary sales tool where customers cannot touch the product. Low-quality images kill trust on sight.
- Communicate value instantly. The main image must be clear enough to stop the scroll. Secondary images and video carry the sales pitch.
- Show rather than tell. Lifestyle images, infographics and short video showing the product solving the problem in context.
- Answer questions visually. Dimensions, what is in the box, model comparisons. Every question answered visually is one less reason to bounce.
If you want to build another level of trust, advanced 3D product rendering techniques can deliver a photorealistic quality standard photography struggles with.
Benefit-driven copy
Titles and bullets are written for shoppers first and Amazon’s ranking systems second. The common mistake is listing features instead of selling benefits. A customer does not care that the drill has a lithium-ion battery. They care that it lasts the whole project.
Feature: Made with 100% Egyptian cotton. Benefit: Breathable, hotel-quality comfort that keeps you cool all night for deeper sleep.
That shift, from what the product is to what it does for the buyer, is the cornerstone of conversion work. Our guide to Amazon listing optimization strategies goes deeper on copy that sells.
Social proof
Review count and star rating are often the strongest conversion drivers on the page. Quality, velocity and rating all matter separately.
- Quality and quantity. A detailed review naming specific features does more than twenty saying “great product.”
- Velocity. A steady stream signals relevance to shoppers and to Amazon. 500 reviews all from two years ago reads as stale.
- Overall rating. A drop from 4.5 to 3.9 can cripple conversion and send ad costs up. It is a direct signal to both audiences that something is wrong.
Catalog strategy and competitive intelligence
Once the page converts, the advanced levers are where market share comes from. Cutting price at the first sign of slowing sales is not a strategy.
- Strategic pricing and promotions. Margin gets destroyed here more than anywhere. Focus on perceived value rather than price cuts. A coupon badge on the search results page is a visual magnet and creates urgency, and a well-timed 5% coupon often outperforms a permanent 10% price drop. Our Amazon anchor pricing strategy covers the framework.
- Competitive monitoring. Watch rival inventory levels. A competitor about to stock out is your signal to bid harder.
- Variation optimization. Consolidate colors, sizes and pack counts into one listing. It pools sales velocity and reviews across every child ASIN.
- Strategic bundling. Virtual Product Bundles raise average order value and introduce customers to the rest of the catalog.
- Subscribe and Save. On consumables, a small recurring discount buys predictable revenue and customer lifetime value.
|
Consolidating variations sounds like a settings change and is not. On a wide catalog it means auditing parentage, resolving orphaned children, and deciding which variants earn a place on the same record before any of that velocity pools. catalog management work is where that gets settled. |
What to do
- Fix the main image and title before anything else. They decide the click, and the click precedes everything else on this list.
- Read price as a conversion variable. Repricing without modeling the conversion impact trades one leak for another.
- Audit review velocity, not just count. A stale review profile reads as risk.
What to avoid
- Rewriting bullets first. It is the easiest change and rarely the binding one.
- Cutting price to fix a conversion problem the images caused.
|
THE LEVER YOU CANNOT WRITE YOUR WAY OUT OF You rewrote the bullets, replaced the hero image, and conversion barely moved. The rating dropped six months ago and nobody treated it as a conversion problem.
20 minutes. Bring your worst-rated ASIN. |
4. The CRO and advertising flywheel
Conversion rate does not sit in a vacuum. It is the fuel for the advertising engine, and treating listing work and paid media as separate functions caps your own growth.
That is why our Amazon PPC management services are built around conversion rather than traffic. When the listing converts, Amazon rewards the relevance with higher ad rank and lower cost per click.
PPC data improves conversion
Campaigns are a source of intent data. Search Term reports show the exact phrases high-converting customers use.
- High-converting terms. If customers search “waterproof hiking boots for rocky terrain,” make sure the title, bullets and A+ Content address durability and rugged use directly.
- High-impression, low-converting terms. Lots of clicks and few sales points at a mismatch between expectation and delivery. That is a copy or main image problem.
Once conversion is dialed in, DSP retargeting becomes a return lever rather than wasted spend. Our Amazon DSP management services turn audience data into incremental revenue.
What to do
- Feed search term data back into listing copy monthly, not quarterly.
- Re-run the bid ceiling calculation after every conversion gain. The headroom is the point.
- Read the principles across channels. These strategies for ecommerce sales growth and conversions apply off Amazon as well as on it.
What to avoid
- Running DSP retargeting before the destination page converts. You are paying to send people somewhere that already failed once.
Decision grid
Which ASIN to fix first, and who owns the answer.
If nobody owns the last row, the rest is a quality exercise rather than a profit one.
How Adverio Helps
Adverio is an agency that runs Amazon, Walmart and Target for consumer brands, measured on contribution margin against a baseline set before the work starts.
On a conversion problem that means running advertising and listing work off the same number rather than as separate workstreams. Treating them separately is what produces a rising ad bill against a flat margin, and it is the most common structure we are asked to fix.
The sequence is conversion first, then spend, because conversion sets what the spend costs. Our Listing Quality Score prioritizes which ASINs to fix and in what order, so the work follows the money.

Frequently asked questions
What is a good conversion rate on Amazon?
Healthy sits around 10 to 15%, though the range moves considerably with category and price point. A sub-$20 product might reach 15 to 20%, while a considered purchase over $100 could sit nearer 3 to 5%.
The average is not the target. Outperforming your direct competitors on your most important keywords is, and Search Query Performance gives you that comparison directly rather than by benchmark. For category-level context, this deep dive into category-specific Amazon conversion rates sets out the ranges.
How much does A+ Content affect conversion?
Reported lifts sit in the 3 to 10% range. A+ Content is where you break out of standard bullets and tell the product’s story, show it in use, answer questions with infographics, and justify a premium price.
Treat it as your in-store display. Neglecting it leaves money on the table when a competitor is one scroll away.
Can I A/B test Amazon listings?
Yes, and you should. Amazon’s Manage Your Experiments tool lets brand-registered sellers run split tests on titles, main images, bullets and A+ Content.
It removes the guesswork from the arguments teams have about which headline is better. Test it rather than debating it.
Why does conversion rate lower my ad costs?
Because Amazon reads conversion as relevance. A listing that converts earns better ad rank at the same bid, and it needs fewer clicks to produce a sale, so your effective cost per acquisition falls twice over.
That is the compounding effect. A conversion gain shows up in the ad account, in organic rank, and in retargeting economics at the same time.
Closing
Fix the conversion floor before the media plan, because the conversion floor is what sets the media plan’s price.
|
The conversion floor is set whether you look at it or not. It is deciding what every click costs you this month either way.
30 minutes. Bring your last 90 days. |
References
Figures on this page are ranges rather than fixed benchmarks, and they move by category and price point.
- Amazon Seller Central, Business Reports documentation. Source for Unit Session Percentage. https://sellercentral.amazon.com/
- Amazon Seller Central, Search Query Performance dashboard. Source for Brand Conversion Share and click share. https://sellercentral.amazon.com/
- Category-specific Amazon conversion rate ranges, cited inline in the FAQ.
- Cross-channel conversion strategies, cited inline in section 4.