It’s time to stop chasing vanity metrics and start tracking the Amazon KPIs that actually drive profit. These metrics span everything from sales velocity and ad efficiency to inventory health, giving you the hard data needed to make smart decisions instead of operating on guesswork.
But most brands are drowning in data and starving for insight. The result is Optimization Myopia, a dangerous fixation on surface-level metrics that quietly erodes margins and stalls growth.
Ready to see how a profit-first KPI strategy can transform your brand?
Why Your Amazon KPIs Are Lying To You
Table of Contents
Let’s be clear: rising revenue and a “good” ACoS don’t mean you’re winning. But these numbers, viewed in isolation, aren’t just misleading—they’re actively hiding the truth about your brand’s health. This is Optimization Myopia, and it’s costing you market share.
Your KPIs are the language of marketplace profitability. Misread them, and you mismanage the business. Listening to just one or two is like hearing a single word of a sentence. A great ACoS means nothing if your total ad spend eats your net profit. A sales spike from deep discounts is a liability if it crushes your contribution margin.
Ditching Vanity Metrics for Real Growth Drivers
Winning on Amazon in 2026 demands a shift in perspective. Stop chasing vanity metrics and start mastering a complete set of performance indicators that tell the whole story. This means asking sharper, more strategic questions:
-
Instead of just ACoS: What’s our Total Advertising Cost of Sale (TACoS)? Is our ad spend driving total sales growth, or are we just paying for sales that would have happened organically?
-
Instead of just Revenue: What’s our net margin per SKU? Are our best-selling products actually our most profitable ones?
-
Instead of just Sessions: What’s our Unit Session Percentage? How efficiently are we converting traffic into actual sales, not just clicks?
Answering these questions forces you to connect the dots between ad performance, operational efficiency, and bottom-line profitability. Without that complete picture, every decision is a gamble. For brands with multivariant catalogs, this is non-negotiable; a single under-optimized listing can poison an entire campaign. A thorough Amazon listing audit can reveal hidden optimization opportunities that directly boost your most important KPIs.
The goal isn’t just to track Amazon KPIs—it’s to build a strategic framework that turns data into decisive action. A successful brand doesn’t just collect metrics; it uses them as a compass to navigate inventory, pricing, and advertising with precision.
The Five Pillars Of Amazon KPI Tracking
If you’re tired of being misled by vanity metrics, you need a structured way to look at your business. Thinking about your Amazon KPIs in silos is a recipe for disaster. Ads, catalog, pricing, and inventory must be governed together. If one constraint breaks, the others cannot compensate. Real clarity comes when you organize them into five strategic pillars that work together to give you a complete, unvarnished view of your business’s health.
Each pillar answers a critical question about your performance. This isn’t just about tracking numbers; it’s about understanding how they connect to the two things that actually matter: profitability and market share.
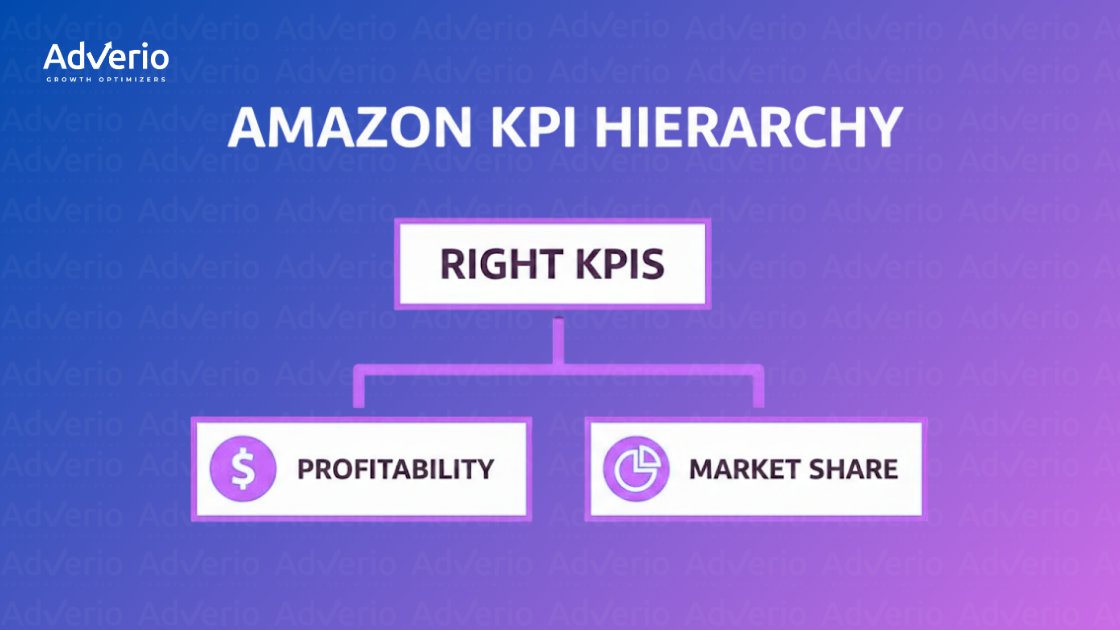
This structure makes it clear: tracking the right KPIs directly feeds your ultimate goals. Let’s break down the core metrics you need to watch within each of these five essential categories.
Core Amazon KPI Categories At A Glance
| KPI Category | What It Measures | Key Metrics Included |
|---|---|---|
| Sales & Revenue | The top-line demand for your products and how effectively you turn traffic into orders. | Total Sales, Sessions, Unit Session Percentage, Repeat Purchase Rate |
| Advertising | The efficiency and overall impact of your ad spend on business growth. | TACoS, ACoS, ROAS, CTR, CVR |
| Profitability | The true financial health of your business after all costs are accounted for. | Net Margin, Contribution Margin, Average Order Value (AOV), Refund Rate |
| Operational | The health of your back-end logistics, inventory management, and account standing. | IPI Score, Stockout Rate, Order Defect Rate (ODR), Late Shipment Rate |
| Brand Health | Your brand’s visibility, customer loyalty, and competitive standing in the marketplace. | Brand Share of Voice (SOV), Brand Halo Sales, Customer Engagement Rate |
Monitoring these categories in tandem prevents isolated decisions—like chasing high sales at the expense of profit or running efficient ads for a product that’s about to stock out. Let’s dive deeper into each pillar.
Pillar 1: Sales & Revenue KPIs
This pillar answers the most basic question: How much are we selling? These top-line metrics gauge demand and your ability to convert traffic. But the nuance is what matters.
-
Total Sales: Don’t just look at one number. Track Ordered Revenue (what customers ordered) versus Shipped Revenue (what you actually got paid for). A large gap signals cancellation or inventory issues.
-
Sessions vs. Unit Session Percentage (USP): Sessions tell you how many unique visits your listings get. But USP is the real star. Calculated as (Units Ordered / Sessions), it measures your conversion rate on a unit basis—a far more honest look at performance. For a deeper dive, check out our guide to Amazon conversion rate optimization.
-
Buy Box Percentage: This is the percentage of time your offer is featured when a customer clicks “Add to Cart.” For brand owners, a low percentage can signal a serious problem with unauthorized third-party sellers.
-
Repeat Purchase Rate: This metric, found in Brand Analytics, shows the percentage of customers who return to buy from your brand again. It’s a direct measure of brand loyalty and product quality.
Pillar 2: Advertising KPIs
This is exactly where most brands need structured Amazon PPC Management Services to align efficiency with incrementality. This pillar answers the real question: Is your advertising expanding market share — or just capturing demand you already own? These metrics move beyond campaign performance to measure the overall health of your marketing investment.
-
TACoS (Total Advertising Cost of Sale): The ultimate health metric for your ad spend. Calculated as (Total Ad Spend / Total Sales), it reveals if advertising is driving incremental growth. A rising TACoS while sales are flat is a huge red flag. Efficiency is not incrementality. A 15% ACoS on branded keywords can look “efficient” while adding zero new growth. If you’re not shifting spend toward generic, competitor, and discovery segments, you’re defending demand, not expanding it.
-
ACoS (Advertising Cost of Sales): Calculated as (Ad Spend / Ad Sales), this measures the direct efficiency of a specific campaign. Useful for tactical adjustments, but dangerously misleading in isolation.
-
ROAS (Return on Ad Spend): The inverse of ACoS, calculated as (Ad Sales / Ad Spend). It shows the dollars generated for every dollar spent on ads.
-
Click-Through Rate (CTR) & Conversion Rate (CVR): CTR measures how compelling your ad creative is, while CVR measures how well your listing converts that traffic into a sale. A high CTR with a low CVR points to a disconnect between your ad promise and your product page reality.
Pillar 3: Profitability KPIs
This pillar cuts through the noise and asks the only question that matters: Are we actually making money? Revenue without margin control is just expensive market share.
-
Net Margin: Your true bottom line after all costs are deducted—COGS, Amazon fees, ad spend, shipping, returns, and overhead. It’s the cash each sale puts in your pocket.
If you’re not calculating margin after ad spend and operational leakage, start with our breakdown of Amazon contribution margin strategy.
-
Contribution Margin: Calculated as (Selling Price – Variable Costs), this metric shows a product’s profitability before fixed costs. It’s essential for smart pricing and ad spend decisions.
-
Average Order Value (AOV): The average dollar amount spent per order. Pushing this up with bundles or virtual cross-sells is one of the fastest ways to boost profitability without needing more traffic.
-
Refund Rate: High refund rates don’t just cost you revenue; they signal a product quality or listing accuracy problem that needs immediate attention.
Pillar 4: Operational KPIs
This pillar addresses a foundational question: Is our back-end running smoothly? Poor operations will sink even the best products. These are the Amazon FBA KPIs that protect your account health.
-
Inventory Performance Index (IPI): Amazon’s score (0-1000) for how well you manage FBA inventory. Drop below 400, and you’ll face storage limits—a death sentence for a growing brand.
-
Stockout Rate: The percentage of time your products are out of stock. This doesn’t just cost sales today; it tanks your organic ranking, creating a long-term problem.
-
Order Defect Rate (ODR): The percentage of orders that receive negative feedback, an A-to-Z claim, or a chargeback. You must keep this below 1% to avoid account suspension.
-
Late Shipment Rate: For FBM sellers, this measures orders shipped after the expected date. Keeping this below 4% is critical for maintaining your selling privileges.
Pillar 5: Brand Health KPIs (For Brand Registered Sellers)
This final pillar answers a crucial long-term question: Are we building a lasting brand asset? In a crowded marketplace, a trusted brand is your only sustainable moat.
-
Brand Share of Voice (SOV): Measures your brand’s visibility on key search terms compared to competitors. It’s a powerful leading indicator of future market share.
-
Brand Halo Sales: Sales of your other products made by customers who initially clicked an ad for a different product in your catalog. A high number proves your brand is strong enough to drive discovery.
-
Customer Engagement Rate: Metrics in Brand Analytics that show how customers interact with your brand over time, like repeat purchases and direct brand name searches.
Translating Metrics Into Strategic Decisions
Data is useless without action. The real skill isn’t just tracking KPIs; it’s understanding the story they tell together and knowing how to react. This is the leap from being a reactive seller to becoming a strategic growth driver.

It’s about spotting problems before they become crises and recognizing subtle signals that point to bigger opportunities.
Identifying and Acting On Red Flags
Your KPIs are an early warning system. When a metric trends in the wrong direction, you need a clear diagnostic workflow to find the cause and deploy a solution before it hits your bottom line.
Consider a common scenario: your TACoS is climbing, but your campaign-level ACoS looks healthy.
-
The Wrong Reaction: “Our ads are fine. Must be a slow month.”
-
The Strategic Diagnosis: A rising TACoS with a steady ACoS often signals ad cannibalization. You’re paying for customers who would have bought your product anyway. This is a clear signal to pivot your ad strategy toward new-to-brand customers or defending against competitors on non-branded keywords.
Here’s another: your Unit Session Percentage (Conversion Rate) starts to drop.
-
The Wrong Reaction: “Let’s crank up the ad budget to get more traffic.”
-
The Strategic Diagnosis: A falling CVR is almost never a traffic problem; it’s a listing problem. It tells you visitors aren’t being convinced to buy. This should trigger an immediate audit of new negative reviews, competitor price drops, or a loss of the Buy Box. Pumping more ad spend here is like pouring water into a leaky bucket.
The Power of Trend Analysis
Isolated data points are noise. Real insights come from tracking KPI trends over time. A single bad sales day is a fluke; a steady week-over-week decline in sessions is a pattern that demands attention.
Your KPI dashboard shouldn’t be a static report. It should be a dynamic tool that visualizes performance over time, allowing you to connect cause and effect with confidence.
By analyzing trends, you can make informed adjustments with predictable outcomes:
-
Inventory Forecasting: If sales velocity is trending up 15% month-over-month, your next inventory order must account for that growth to avoid a costly stockout.
-
Campaign Adjustments: Noticing your ad CTR drops every weekend could lead to a dayparting strategy, lowering bids during less effective periods to save money.
-
Pricing Strategy: If a competitor consistently undercuts you on the 1st of every month, you can proactively adjust your pricing to protect your Buy Box win rate.
This level of analysis is impossible when jumping between scattered reports. A unified KPI dashboard is non-negotiable for any brand serious about growth. It pulls every critical metric into a single source of truth. To ensure your efforts lead to real improvements, you have to track content performance for better results across all your assets. This same principle separates high-growth brands and is fundamental to improving Amazon customer lifetime value.
Building Your Amazon KPI Dashboard
Knowing your KPIs is one thing. Wrangling them into a single, coherent view is another. Constantly jumping between Seller Central, the Ads Console, and spreadsheets creates massive blind spots. A centralized dashboard isn’t optional — it’s governance.
Without real-time visibility into margin, share, and incrementality, you’re guessing. That’s why we build KPI governance into our Business Intelligence for Amazon brands framework.

You can build a solid foundation using Amazon’s free tools, but they have limits.
Starting with Native Amazon Tools
Amazon’s own reporting suite is the source of truth for your raw data.
-
Seller Central Business Reports: Ground zero for sales and traffic data. Find essential metrics like Sessions, Unit Session Percentage, and Buy Box Win Rate. It’s powerful for top-line performance but lacks context on advertising or true profitability.
-
Amazon Ads Console: This is where you live for campaign-level metrics—ACoS, ROAS, and CTR. It’s indispensable for tactical optimization but doesn’t connect ad spend to your total business health.
-
Brand Analytics & Search Query Performance Report (SQPR): For Brand Registered sellers, these tools are gold. Brand Analytics offers insights into customer behavior, while the SQPR provides data on search volume, CTR, and conversions for your top keywords.
The problem? These tools live on separate islands. You can’t easily see how a spike in ad spend (Ads Console) impacted your total profitability. This is where third-party platforms build the bridges.
Aggregating Data with Third-Party Platforms
To get a truly holistic view, you must pull all your data into one place. Third-party analytics dashboards like Intentwise, DataHawk, or Sellerboard were built for this. They connect the dots between sales, advertising, inventory, and—most importantly—profitability.
A purpose-built dashboard isn’t just a convenience; it’s a strategic necessity. It stops you from making decisions based on incomplete information and reveals the critical relationship between metrics like TACoS and Net Margin in real-time.
These platforms integrate with Amazon’s APIs to pull data from every corner of your account. They automatically calculate complex metrics and lay them out in customizable dashboards, letting you spot trends in seconds, not hours. This unified view is the foundation of a robust business intelligence strategy for e-commerce and the key to turning data into a growth engine.
Four Costly KPI Mistakes That Stagnate Growth
Let’s get straight to it. Tracking KPIs is only half the battle. The real damage happens when brands misinterpret the data, sending them down a path of stagnant growth and shrinking margins. Avoiding these common blind spots is non-negotiable.
Mistake 1: Over-Optimizing for ACoS and Ignoring TACoS
Obsessing over a low ACoS is the most common form of “Optimization Myopia.” A low ACoS feels efficient, but it tells you nothing about the health of your total business. The solution is to shift your focus to Total Advertising Cost of Sale (TACoS). This metric reveals the true relationship between your ad spend and your total revenue. If your TACoS is decreasing while sales are climbing, your ads are driving genuine growth. If it’s rising, you might just be cannibalizing organic sales. To dig deeper, check out these common Amazon PPC mistakes brands make.
Mistake 2: Misreading Low ROAS in Isolation
Not all ad campaigns are built for immediate sales. A low Return on Ad Spend (ROAS) on a top-of-funnel DSP campaign isn’t a failure—it’s an investment in brand building. These campaigns introduce new customers to your brand. Judging them by the same ROAS standards as a bottom-funnel Sponsored Products campaign is a critical error. The real measure of success is an increase in branded search volume and Brand Halo Sales over time. Sacrificing top-of-funnel investment for a superficially “efficient” ROAS starves your future sales pipeline.
Mistake 3: Chasing Revenue Without Margin Visibility
Revenue growth is a vanity metric if it comes at the expense of profit. Aggressive promotions and high ad spend can easily create a scenario where you’re selling more but earning less. Without a clear view of your Net Margin and Contribution Margin per SKU, you’re flying blind. You must have a system to track profitability after all costs are accounted for.
A high-revenue, low-profit business isn’t a growth engine; it’s a cash-burning machine. Sustainable scale requires tying every decision back to its impact on your bottom line.
Mistake 4: Neglecting Operational KPIs That Damage Listing Health
It’s a fatal error to focus on sales and advertising while ignoring the operational KPIs that can silently throttle your business. A declining Inventory Performance Index (IPI) score can lead to FBA storage limits that cap your growth, no matter how great your ads are. Metrics like your Stockout Rate and Order Defect Rate (ODR) directly impact your organic ranking, Buy Box eligibility, and your very ability to sell. Neglecting them is like building a skyscraper on a foundation of sand.
Stop Guessing. Start Growing With a Clear KPI Strategy.
Mastering your Amazon KPIs isn’t about collecting data; it’s about making strategic moves. Relying on surface-level metrics is a guaranteed path to stalled growth in today’s hyper-competitive marketplace.
A clear strategy means embracing a unified view that ties advertising, operations, and profitability together. Real success is built on understanding how the five pillars—Sales, Advertising, Profitability, Operations, and Brand Health—all feed into each other. You have to see exactly how ad spend impacts net margin and how inventory health dictates ranking potential.
Chasing revenue without a clear line of sight to profit is like running on a treadmill—plenty of motion, but you’re not going anywhere. The goal isn’t just to sell more; it’s to earn more with every sale.
When you move past isolated metrics like ACoS and focus on a comprehensive dashboard, you spot problems before they blow up and seize opportunities your competitors miss. You can finally connect every decision directly to your bottom line, turning data into your most powerful growth asset.
The insights are already in your data. For brands ready to align their Amazon KPIs with a proven growth framework, the next step is getting a clear picture of the path forward.
If you can’t clearly explain how your TACoS impacts your net margin, it’s time to fix it.
Book your no-obligation ROI Forecast with an Adverio expert and get a clear roadmap for profitable scale.
Your Top Amazon KPI Questions, Answered
Let’s clear up the most common questions about tracking Amazon KPIs.
What Is a Good TACoS on Amazon?
It depends. A “good” Total Advertising Cost of Sale (TACoS) changes based on your product’s maturity and current goals.
-
For a new product launch: A higher TACoS (20-30%) is normal. You’re buying data, building visibility, and generating crucial first reviews. It’s an investment.
-
For a mature, profitable product: Your target should be much lower (5-10%). Here, advertising is about efficiently defending market share, not aggressive growth.
The goal isn’t a universal number; it’s ensuring your TACoS reflects the strategy for that specific ASIN.
How Often Should I Check My Amazon KPIs?
Not every metric needs daily attention. A tiered approach is more effective.
-
Daily Check-In (5-10 minutes): A quick pulse check. Glance at campaign ACoS, overall sales, and ad spend to spot red flags.
-
Weekly Deep Dive (1 hour): This is for real analysis. Dig into TACoS, Unit Session Percentage, and keyword trends to make tactical tweaks.
-
Monthly Strategic Review: Zoom out. Look at Net Margin, IPI, and Brand Share of Voice to inform major decisions on pricing and inventory.
What’s the Difference Between ACoS and ROAS?
ACoS (Advertising Cost of Sales) and ROAS (Return on Ad Spend) are two sides of the same coin.
-
ACoS = Ad Spend ÷ Ad Sales (a percentage)
-
ROAS = Ad Sales ÷ Ad Spend (a multiplier, like 5x)
A 20% ACoS is the same as a 5x ROAS. Neither is inherently better, but profit-focused sellers often prefer ACoS because it relates directly to product margins, making it easier to see if ads are profitable.
Stop chasing vanity metrics and start building a profit-driven growth engine. At Adverio, we transform scattered data into a clear, actionable strategy that connects every decision to your bottom line.
Book Your ROI Forecast and see the impact of a truly unified KPI strategy.