Table of Contents
The largest and most successful sellers always seem to make it look easy to find new products to add to their catalog, while the rest of the crowd pays for third-party tools such as Helium10, JungleScout, Sellerise, and similar.
Secret #1: These Top Sellers leverage our favorite Amazon Product Research tool, SmartScout. This 3P tool charges, whereas the ones below are free.
Secret #2: Those same Top Sellers also leverage two extremely powerful and underutilized Amazon tools that are 100% FREE(!): Amazon Product Opportunity Explorer and Amazon Market Basket Analysis.
Join me below as we dive deep into these free tools that are constant game-changers for savvy sellers like you. They can enable you to expand your catalog, uncover new opportunities, and make informed decisions to boost your business consistently.
By effectively using these Top Amazon Product Research Tools and staying updated on market trends, you can gain a competitive edge and achieve steady growth in 2024 and beyond.
Understanding the Product Opportunity Explorer
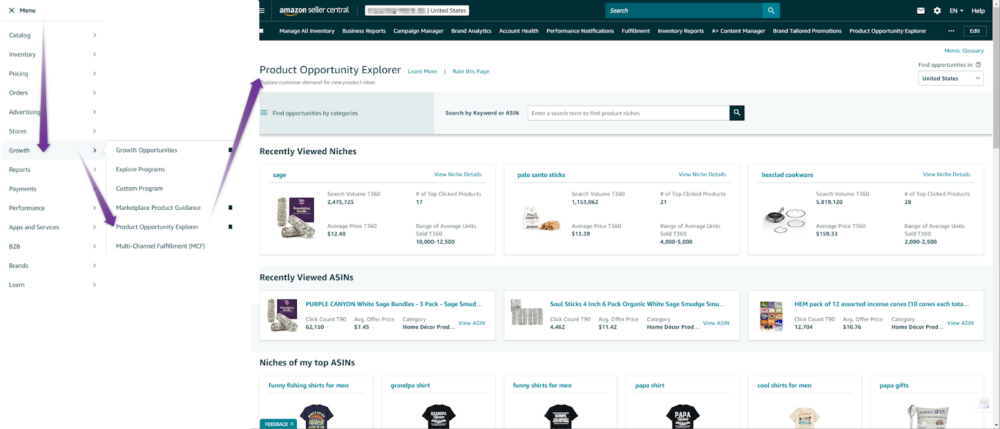
Launched in 2021, the Product Opportunity Explorer (POE) should be a go-to tool for Amazon sellers seeking to identify profitable niches and understand evolving customer demands. It’s mind-boggling(!) how many sellers I see on a daily basis that have never used Amazon’s POE.
The Product Opportunity Explorer harnesses the power of Amazon’s vast data repository to offer a comprehensive view of customer behavior and market dynamics. It takes into account a range of factors, including product seasonality, historical prices, and performance over time, enabling sellers to make informed decisions about their product selection and go-to-market strategies. These Real-time insights into customer search patterns, product demand, and emerging trends are analyzed and compiled via weekly refreshed data.
As of May 2024, there are two primary views that you can drill down:
Niche Details View
This view allows sellers to explore various product niches by search terms, keywords, and sub-categories, helping them identify untapped market segments with growth potential. There are 6 primary sections within Amazon’s Product Opportunity Explorer’s Niche Details Page view. The amount of information can be a bit overwhelming at first glance. However, I aim to break those down into more digestible segments below.
ASIN Product Details Pages View
You can perform a more granular assessment of the niche details at a single product level. This includes many of the same metrics from the Niche Details but for the single user selected ASIN. Below are snapshots of each view, along with key takeaways for each of the Niche Details and ASIN (Product) Sections found here: Product Opportunity Explorer
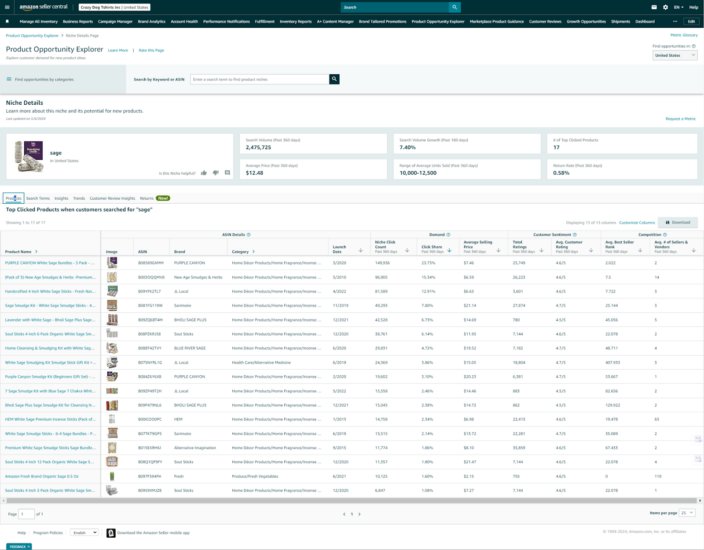
Products: Product Opportunity Explorer Amazon Niche Details
Niche Exploration:
Within the product view, there are 13 columns available, including launch dates, niche click counts and click shares, average selling prices (ASP), customer sentiment across total ratings, and review quality, among others
You’ll be able to quickly ascertain the depth and breadth of various niches along with varying levels of competition. Be prepared, as there will be a few head-scratchers where newly released products are among the top results even though they lag behind in customer sentiment.
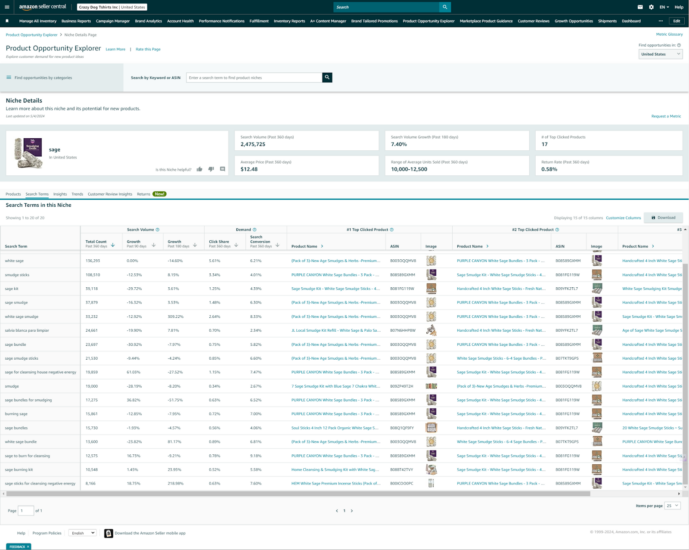
Search Terms: Product Opportunity Explorer Amazon Niche Detail
Keyword Insights:
The Product Opportunity Explorer provides valuable insights into top customer search terms for each niche. By understanding the semantics customers use when searching for products, sellers can optimize their product listings, improve discoverability, and drive more traffic to their offerings.
Additionally, you can determine customer search volume deltas and demand patterns via click share and search conversions over the past 90, 180, and 360 days, sellers can uncover emerging trends and be among the first to capitalize on new opportunities.
This is another way to better understand any shifts in search trends in your current niche, which may be improving or declining over time.
Insights: Product Opportunity Explorer Amazon Niche Details
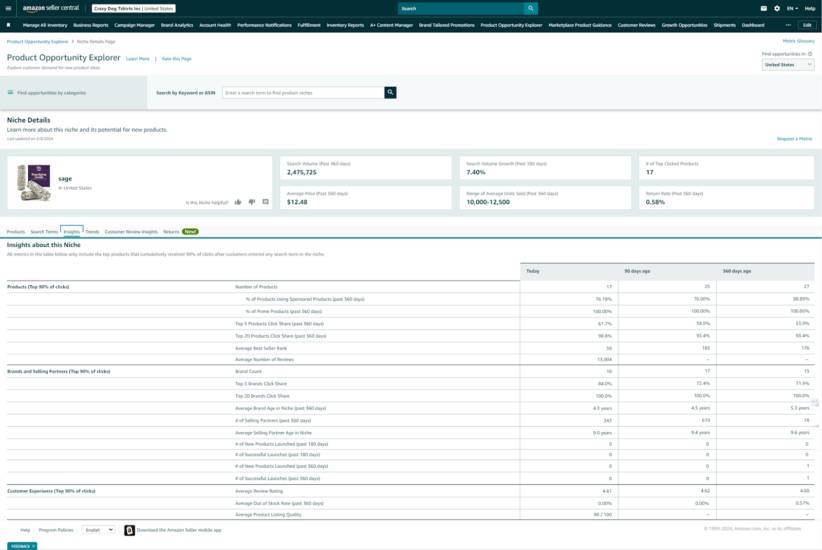
Competitive Analysis:
Sellers can use the view to further evaluate the competitive landscape within specific niches. By analyzing factors such as average selling price, number of reviews, and top-performing products, sellers can benchmark their offerings against competitors and make strategic decisions to differentiate themselves.
One of our favorites is seeing Top 5 Products Click Share (past 360 days) decreasing from 360 days ago to 90 days ago and today. If the opposite is true, then it’ll be more challenging to capture market share.
Trends: Product Opportunity Explorer Amazon Niche Details
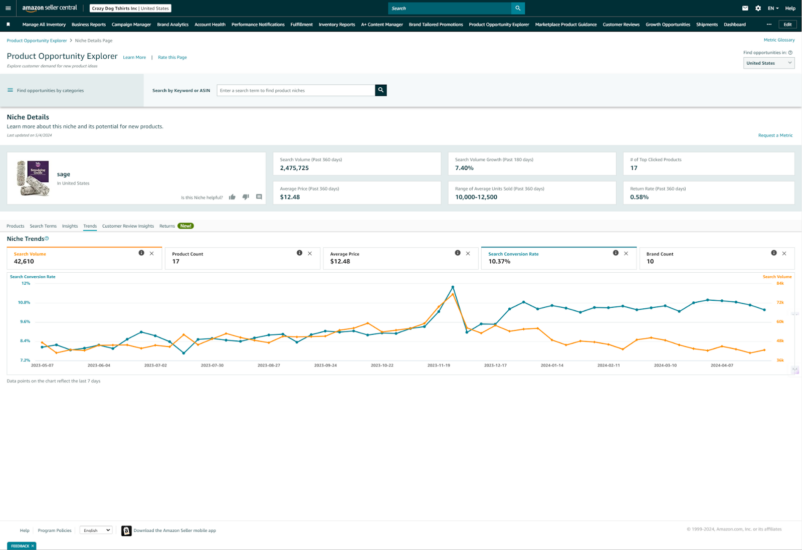
Directionality:
This is another visual way to better understand a niche’s trends, which may be improving or declining over time. We like to refer to Search Volume, Search Conversion Rate, and Average Price over time. If you notice a decline in all three, then it’s likely time to look at another niche. Furthermore, it can be rather insightful as to whether there is any seasonality and price elasticity over the last 12 months.
Another view includes Product Count and Brand Count. This helps us understand the ebbs and flows of new entrants into the market at both the product and brand level. You’ll likely be surprised as the volatility over 12 months.
Customer Review Insights: Product Opportunity Explorer Amazon Niche Details
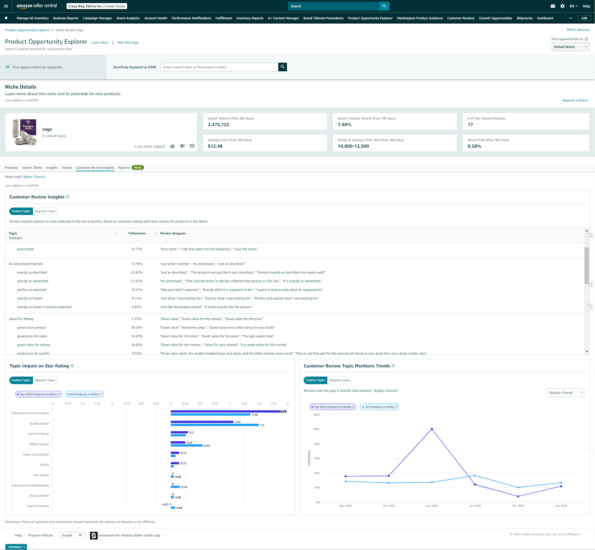
Product Development Guidance:
The Product Opportunity Explorer offers data-driven product development and optimization recommendations. By identifying unmet customer needs and analyzing successful product attributes, sellers can refine their product offerings to better align with customer preferences and market demands.
One of the key advantages of the Product Opportunity Explorer is its ability to surface customer review insights. By analyzing customer feedback, sellers can gain valuable information about product strengths, weaknesses, and areas for improvement.
This data-driven approach allows sellers to refine their offerings continuously and address common pain points, ultimately leading to higher customer satisfaction and increased sales.
Returns: Product Opportunity Explorer Amazon Niche Details
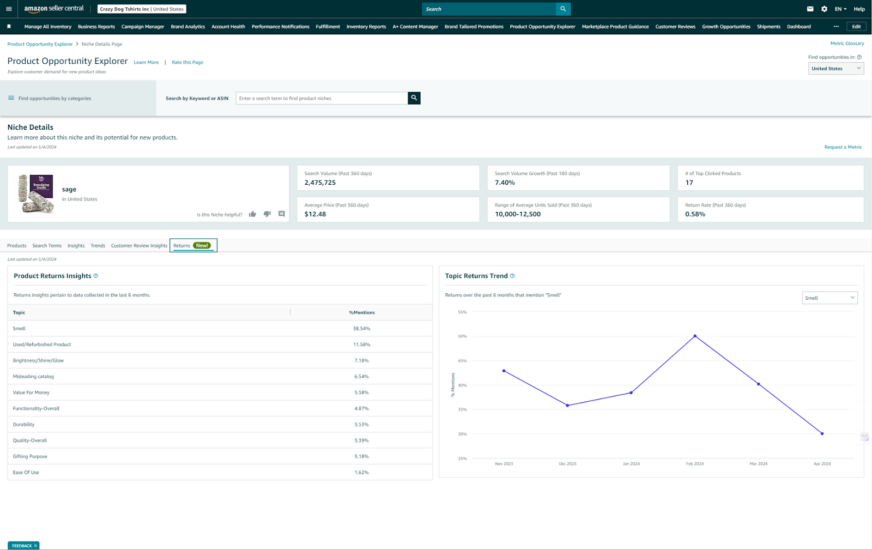
To Keep or Not to Keep:
Another critical feature of the Product Opportunity Explorer is its returns analysis capability.
By identifying products with high return rates and understanding the underlying reasons, sellers can optimize their product offerings and reduce the costs and hassles associated with returns. This proactive approach improves the customer experience and helps sellers maintain a healthy bottom line.
Product Metrics: Product Opportunity Explorer Amazon Product Details Page
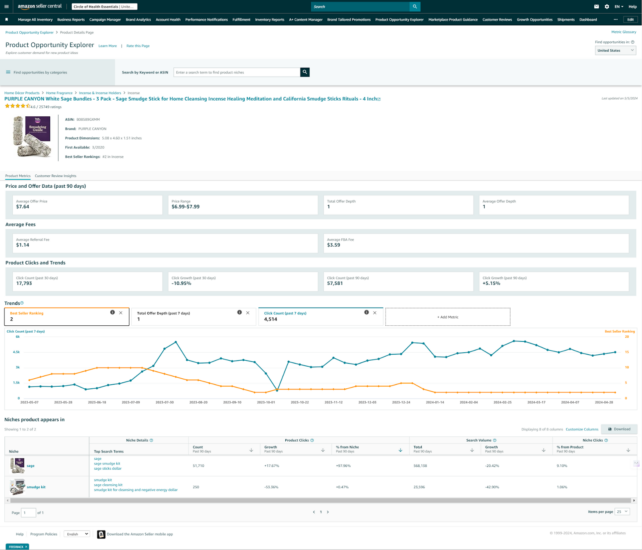
- Product Exploration: Similar to the Niche Product overview, you’ll also see product-specific insights into click growth or decline, over the past 30 and 90 days, Referral and FBA Fees, as well as offer depth.
Customer Review Insights: Product Opportunity Explorer Amazon Product Details Page
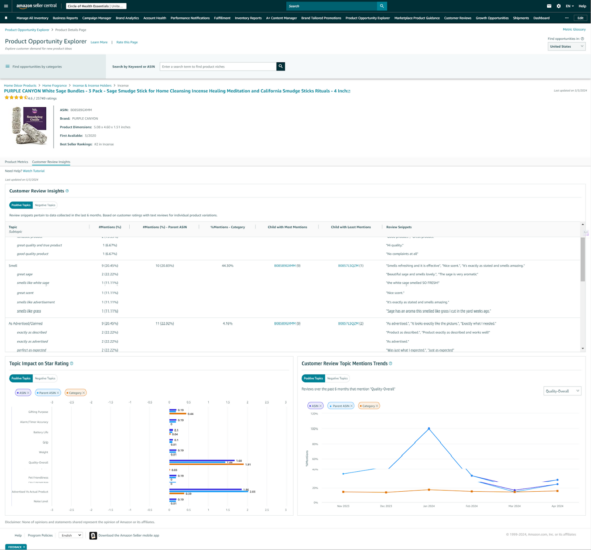
- Product-Specific Sentiments: The Product Opportunity Explorer offers data-driven product development and optimization recommendations.
By identifying unmet customer needs and analyzing successful product attributes, sellers can refine their product offerings to better align with customer preferences and market demands.
One of the key advantages of the Product Opportunity Explorer is its ability to surface customer review insights at the product level. By analyzing customer feedback, sellers can gain valuable information about product strengths, weaknesses, and areas for improvement.
This data-driven approach allows sellers to refine their offerings continuously and address common pain points, ultimately leading to higher customer satisfaction and increased sales.
Utilizing the Strength of Market Basket Analysis
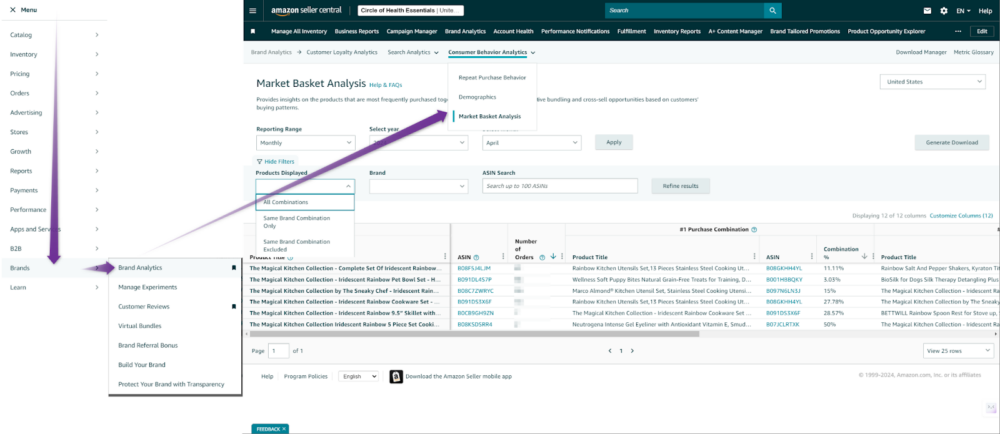
While the Product Opportunity Explorer helps sellers identify new product opportunities, Market Basket Analysis enables them to optimize their existing offerings and drive cross-selling opportunities. This powerful tool, available through Amazon Brand Analytics, provides insights into which products customers frequently purchase together
Amazon Market Basket Analysis dashboard identifies the products that your customers purchased together to help find cross-selling and bundling opportunities.
Here are a few general definitions from Amazon Seller Central for clarification of the underlying data:
Purchase Combination %: Percentage of orders that contain both the selected ASIN and the #1, #2, or #3 Purchase Combination ASIN, in comparison to the total number of orders that contained at least two different items including the selected ASIN.
Product Title: The title of the product as displayed in the search results page.
The title length can vary but we limit it to 50 characters initially. Click the arrow in the column heading to expand and get full details.
ASIN: ASIN stands for Amazon Standard Identification Number. ASIN ID is guaranteed to be unique within a marketplace.
By analyzing customer purchase patterns, sellers can identify complementary products and create targeted bundles or promotions to encourage multi-item purchases. This not only increases the average order value but also enhances the customer experience by providing convenient and relevant product combinations
Market Basket Analysis also helps sellers optimize their inventory management and pricing strategies. By understanding which products are commonly bought together, sellers can ensure they have sufficient stock of complementary items and adjust their pricing to maximize profitability.
How to Interpret Your Commingled Data
As your product catalog size increases, it becomes increasingly difficult to digest the data, even after downloading the report from Amazon. That’s largely because there will be more rows to analyze AND cross-overs across multiples of your products.
Fortunately, Amazon does some of the initial lifting for us by offering 3 uniquely segmented tabular views:
1) Same Brand Combination Only – This filters the purchase combinations to only include Combination Percentages when more than one of your products was purchased within the same shopping cart.
2) Same Brand Combination Excluded – On the flip side, this display selection explicitly excludes purchase combinations when more than one of your products was purchased within the same shopping cart. This is our current favorite, although #1 is a very close second.
3) All Combinations – Amazon doesn’t include to exclude purchase combinations based on brands purchased and simply displays the top purchase combinations for each of your catalog ASINs.
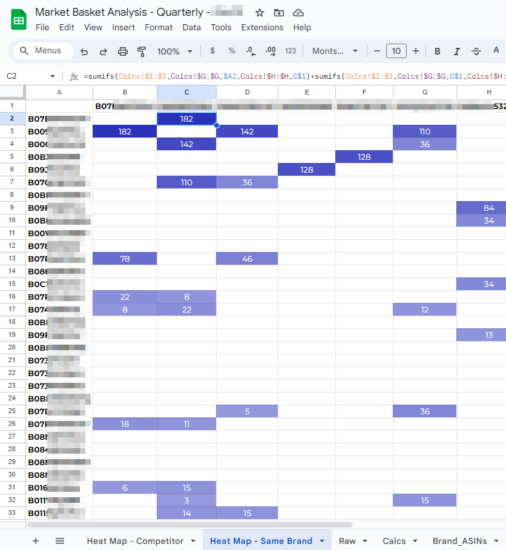
This is the exact tool that we built and leveraged for all of our brands.
For example, while auditing one of our prospective brands, we found a complementary product with an even higher price tag than their core product.
Using our tool, we noticed that 100s of shoppers were also adding another popular ASIN to their shopping cart. So we dug deeper and found out that over 1,000 shoppers were adding to their cart a nearly identical product to the popular one that was also being added by 100s of shoppers.
With information such as this, you can quickly glean which products to launch next. Instead of 1,000s of shoppers having to buy from another brand, you can offer that same product that will increase your Average Order Value (AOV), increase Return on Ad Spend (RoAS), and raise your Customer Lifetime Value (LTV) by retargeting and cross-selling them along their buying journey.
Other Strategies for Leveraging Product Opportunity Explorer and Market Basket Analysis
To fully capitalize on the insights provided by these powerful tools, Amazon sellers should consider the following strategies:
Regularly Monitor Market Trends:
Stay up-to-date with the latest insights from the Product Opportunity Explorer to identify emerging trends and adapt your product offerings accordingly. By being proactive and responsive to market changes, you can stay ahead of the competition and meet evolving customer demands
Optimize Product Listings:
Use the keyword insights from the Product Opportunity Explorer to optimize your product titles, descriptions, and bullet points. Incorporate relevant and high-volume search terms to improve your product’s discoverability and attract more qualified traffic
Experiment with Product Bundles:
Leverage Market Basket Analysis to create compelling product bundles that encourage multi-item purchases. Test different bundle combinations and pricing strategies to find the most effective approach for your target audience.
Invest in Complementary Products:
Identify products that are frequently bought together and consider adding them to your catalog. By offering a wider range of complementary items, you can capture a larger share of customer spend and improve overall profitability
Continuously Refine Your Strategy:
Regularly review the insights from both tools and use them to inform your ongoing product development, marketing, and pricing strategies. Continuously test and refine your approach based on data-driven insights to optimize your performance over time.
Leverage Customer Reviews:
Pay close attention to customer reviews and feedback gathered through the Product Opportunity Explorer. Use this valuable information to identify areas for improvement, address common customer pain points, and enhance your product offerings. By demonstrating responsiveness to customer needs, you can build trust, loyalty, and a positive brand reputation.
Collaborate with Complementary Brands:
Consider partnering with other brands that offer complementary products to yours. By leveraging Market Basket Analysis insights, you can identify potential collaboration opportunities and create joint promotions or cross-selling initiatives. Collaborating with complementary brands can help you reach new audiences, expand your market share, and drive mutual growth.
Personalize Your Marketing Efforts:
Use the insights from Market Basket Analysis to create personalized product recommendations and targeted marketing campaigns. By understanding the products customers frequently purchase together, you can tailor your email marketing, retargeting ads, and on-site recommendations to individual customer preferences. Personalization can significantly improve customer engagement, conversion rates, and overall sales.
Optimize Inventory Management:
Leverage Market Basket Analysis to streamline your inventory management processes. By anticipating which products are likely to be purchased together, you can ensure you have sufficient stock levels to meet customer demand. This proactive approach can help you avoid stockouts, reduce overselling, and improve customer satisfaction.
Monitor Competitor Activity:
Keep a close eye on your competitors’ activities using the Product Opportunity Explorer. Regularly analyze their product offerings, pricing strategies, and customer reviews to identify potential gaps or areas where you can differentiate yourself. By staying informed about your competitors, you can make data-driven decisions to maintain your competitive edge.
The Product Opportunity Explorer and Market Basket Analysis are invaluable tools for Amazon sellers looking to grow their businesses in 2024 and beyond. By leveraging the insights provided by these tools, sellers can identify untapped opportunities, optimize their product offerings, and make data-driven decisions to drive sales and profitability.
However, success on Amazon requires more than just access to powerful tools. It demands a willingness to continuously learn, adapt, and innovate. By staying attuned to market trends, customer preferences, and competitor activities, sellers can position themselves for long-term success in the dynamic world of eCommerce.
As you embark on your journey to unlock growth opportunities on Amazon, remember to approach these tools with a strategic mindset. Use the insights they provide to inform your decision-making, but also rely on your own business acumen and customer understanding. By combining data-driven insights with your unique value proposition and customer-centric approach, you can build a thriving and sustainable Amazon business.
If you’re looking for expert guidance in managing your Amazon business and leveraging the power of Product Opportunity Explorer and Market Basket Analysis, look no further. Adverio is here to support you every step of the way, starting with one of the free tools that we’ve built and have been using for all over brands since 2014
This is the exact tool that we built and leveraged for all of our brands.
Appendix: Metric Glossary from Amazon Product Opportunity Explorer
Here is a list of comprehensive definitions of all metrics offered across Product Opportunity Explorer provided by Amazon Seller Central:
Supported Marketplaces
Niche Experience
The Product Opportunity Explorer Niche Experience is currently available in the following marketplaces: United States, United Kingdom, Germany, France, Italy, Spain and Japan.
ASIN Experience
The Product Opportunity Explorer ASIN Experience is currently available in the following marketplaces: United States, United Kingdom, Germany, France, Italy, Spain, Japan, Sweden, Poland, Belgium and Netherlands.
ASIN Details
Product Name
Product name of the ASIN
ASIN
ASIN stands for Amazon Standard Identification Number. It’s a unique identifier of 10 letters and/or numbers for a product
Product Dimensions
Dimension of the product mentioned on Amazon
First Available
Date when ASIN’s first buyable offer is available on Amazon.
Best Seller Rankings
The best seller rankings of this product, within its specific sub categories on Amazon.
ASIN Details: Niche product appears in
Niche Details
Niche
The list of niches that this product appears in
Top Search Terms
Top search terms in the niche that drive the most clicks to this product in the past 90 days.
Product Clicks
Product Click Count (Past 90 days)
Clicks on this product over the past 90 days that are driven by search terms in this niche.
Product Click Growth (Past 90 days)
Trend of click count for this product from search terms in this niche, compared to prior 90-day period
Percent Product Clicks from Niche (Past 90 days)
Percentage of overall product clicks driven by a given niche.
Search Volume
Search Volume (Past 90 days)
The total number of times customers entered any of the search terms in this niche on Amazon in the past quarter (90 days).
IMPORTANT: We include all search terms issued within a day. For example, if the same search term is issued by the same customer session in a 24 hour time period more than once, we will include all of those instances in the total query volume. Also, clicking on the next page of search results will increment search volume.
Search Volume Growth (Past 90 days)
Across all of the search terms shown in this niche, the percentage change in search term volume in the past quarter (0-90 days), compared to the volume from the previous 90 days (90-180 days).
Niche Clicks
% from Product (Past 90 days)
Percent of clicks product contributes to a given niche within past 90 days.
ASIN Details: Product Metrics
Price and Offer Data
Average Offer Price (Past 90 days)
Average featured offer price over the past 90 days. Average is weighted by page views.
Price Range (Past 90 days)
Highest and lowest featured offer price over the past 90 days.
Total Offer Depth (Past 90 days)
The maximum number of sellers offering this product at any point over the past 90 days.
Combining the Total Offer Depth and Price Range for a product can illustrate how Sellers competing for the Buy-Box on as ASIN can impact the featured offer price.
Average Offer Depth (Past 90 days)
The average number of offers for this product over the past 90 days weighted by page views
Average Fees
Average Referral Fee (Past 360 days)
Average referral fee paid for units sold over the past 360 days across all Selling Partners. Average fee provided for reference only, actual fee may vary.
Average FBA Fee (Past 360 days)
Average FBA fee paid for units sold over the past 360 days across all Selling Partners. Average FBA fee provided for reference only, actual fee may vary.
Review the Average FBA Fee for Top Clicked ASINs in a niche to identify potential opportunities to be price competitive by reducing fees through smaller packaging.
Product Clicks
Click Count (Past 30 days)
Total customer clicks on this ASIN from any search term over the past 30 days.
Click Growth (Past 30 days)
Trend of click count for this ASIN, compared to prior 30-day period.
Click Count (Past 90 days)
Total customer clicks on this ASIN from any search term over the past 90 days.
Calculated by counting all clicks in the past 90 days on this ASIN once a customer searches for a product using any search term.
Click Growth (Past 90 days)
Trend of click count for this ASIN, compared to prior 90-day period.
Calculated by comparing 90 days of click counts over the previous 90 days, resulting in either a positive or negative percentage.
ASIN Details: Trends
Best Seller Ranking
The ASIN’s Best Seller Ranking as of the indicated date.
Click Count (Past 7 days)
Total customer clicks from any search term in the past 7 days as of the indicated date.
Calculated by counting all clicks in the past 7 days as of the indicated date, once a customer searches for a product using any search term.
Total Offer Depth (Past 7 days)
The average number of offers listed on this ASIN in the past 7 days as of the indicated date.
ASIN Search/Browse Results
ASIN Details
Product Name | ASIN
Product name (of the ASIN). This is a clickable link that takes you to the Product Detail Page.
ASIN
ASIN stands for Amazon Standard Identification Number. It’s a unique identifier of 10 letters and/or numbers for a product
Brand
Name of the brand of the product
Category
Path to the product within the Amazon browse hierarchy, up to 3 levels deep. Taxonomy depth varies across categories.
Launch Date
Date when ASIN’s first buyable offer is available on Amazon.
Demand
Search Click Count (Past 360 days)
Total number of clicks on this product, after a customer sees the product as a result from any search term.
This number differs from the “Niche Click Count”, as it includes all search terms that led to a click, even if they are not included in a niche.
Price Details
Average Selling Price
Average selling price of products for the past 90 days
Customer Sentiment
Total Ratings
Total number of reviews for the product, as of the most current snapshot, data refers to the past 360 days. Currently this only includes reviews where the customer provided written product feedback.
Average Customer Rating
Average star rating customers gave the product in a review out of 5 stars. Currently this only includes reviews where the customer provided written product feedback.
Competition
Average Best Seller Ranking
The best seller rank of this product, within its specific sub category on Amazon. Note: Products in this niche may be part of different sub categories. to identify the BSR category, it can be viewed under each ASINs product metrics tab.
Total Offer Depth (Past 90 days)
The maximum number of sellers offering this product at any point over the past 90 days.
Niche Search/Browse Results
Niche Details
Customer Need
Niches are a clustering of similar search terms or “keywords” and their top clicked and purchased ASINs to reflect Amazon customer shopping behavior and customer needs.
- Customers tell Amazon what they want when they enter search terms in the Store to find their next purchase. Amazon combines similar search terms around specific customer needs by identifying top clicked and purchased products to create “niches”. Top Products included in the niche cumulatively receive 90% of clicks and purchases after customers entered any search term in the niche. The number of search terms displayed is currently capped based on which search terms have the greatest search volume. Likewise, products in a niche are limited to 500 that received the majority of the clicks and purchases from the search terms shown.
- Niches contain insights on customer needs. For example, if customers can’t find what they are looking for (ex. low conversion) or are dissatisfied with currently available products (ex. low customer review ratings), Sellers can use this customer demand data to identify opportunities to build a better customer experience by optimizing their catalog to meet customer needs or launching new products to create new demand.
Image
The image of Niche is the image of the product with highest Click Share (%) among the products that are in Niche.
Top Search Terms
Top search terms that have the highest search volume for this niche in the past 90 days that drive the most clicks to this product
- Search terms you see here are what have been typed by the customer and grouped into this niche based on similar clicked and purchased products.
- The search terms include both “broad shopping intent” and spearfishing or “specific shopping intent” queries.
# of Top Clicked Products
# of top products that cumulatively received 90% of clicks and purchases after customers entered any search term in the niche.
Search Volume
Search Volume (Past 360 days)
The total number of times customers entered any of the search terms in this niche on Amazon in the past year (360 days).
IMPORTANT: We include all search terms issued within a day. For example, if the same search term is issued by the same customer session in a 24 hour time period more than once, we will include all of those instances in the total query volume. Also, clicking on the next page of search results will increment search volume.
Search Volume Growth (Past 180 days)
Across all of the search terms shown in this niche, the percentage change in search term volume in the past 180 days(180-0 days), compared to the volume from the previous 180 days (360-180 days).
Search Volume (Past 90 days)
The total number of times customers entered any of the search terms in this niche on Amazon in the past quarter (90 days).
IMPORTANT: We include all search terms issued within a day. For example, if the same search term is issued by the same customer session in a 24 hour time period more than once, we will include all of those instances in the total query volume. Also, clicking on the next page of search results will increment search volume.
Search Volume Growth (Past 90 days)
Across all of the search terms shown in this niche, the percentage change in search term volume in the past quarter (0-90 days), compared to the volume from the previous 90 days (90-180 days).
Price Details
Average Price (Past 360 days)
The average selling price for all products in this niche in the past 360 days.
Price Range (Past 360 days)
Minimum and maximum selling price (over the last 360 days) for products in this niche.
Sales
Units Sold (Past 360 days)
Total number of units sold in last 360 days for all products in this niche when such products were clicked after a customer entered any of the search terms within the niche.
- Units sold includes purchase actions for the search term, originating from the search result. The units sold totals may not match the total count from your sales reports as these metrics include only those originated from Search results (search conversion purchases).
- It includes purchases that happened within a day. For example, starting from the query and all funnel metrics such as impressions, clicks, cart adds and purchases, all actions should have happened within the 24 hours period (i.e., attribution time period is 24 hours). If a customer queried, added to cart but purchased the following day, then that purchase will remain unattributed. We will enhance this attribution approach in future releases.
Range of Average Units Sold (Past 360 days)
Total number of units sold in last 360 days for all products in this niche when such products were clicked after a customer entered any of the search terms within the niche (Units Sold (Past 360 days)) divided by the total number of products in the niche.
- Units sold includes purchase actions for the search term, originating from the search result. The units sold totals may not match the total count from your sales reports as these metrics include only those originated from Search results (search conversion purchases).
- It includes purchases that happened within a day. For example, starting from the query and all funnel metrics such as impressions, clicks, cart adds and purchases, all actions should have happened within the 24 hours period (i.e., attribution time period is 24 hours). If a customer queried, added to cart but purchased the following day, then that purchase will remain unattributed. We will enhance this attribution approach in future releases.
Return Rate (Past 360 days)
The total number of units returned divided by the total number of units sold for all products in this niche in last 360 days.
The calculation of return rate is different from other metrics in Sales section. While metrics like Units Sold (Past 360 days) only include sales that were completed after a search in Amazon.com for all the products in this niche, Return Rate includes all units returned and all units sold for all products in this niche.
Niche Details: Insights
Number of Products
Products receiving the majority of clicks from the search terms in this niche
The number of top products that cumulatively received 90% of clicks after customers entered any search term in the niche.
% of Products Using Sponsored Products (past 360 days)
Percent of products in the niche with Sponsored campaigns.
% of Prime Products (past 360 days)
Percent of products in the niche which were Prime eligible for majority of times when their page was viewed by the customers.
Top 5 Products Click Share (past 360 days)
The combined click share by top 5 products compared to all products in the niche.
Top 20 Products Click Share (past 360 days)
The combined click share by top 20 products compared to all products in the niche.
Average Best Seller Ranking
Average BSR from top 90% products within the niche in the past 360 days
Average Number of Reviews
Average number of reviews across products in this niche.
Brand Count
Number of brands for all products in the niche at the time of the snapshot.
Top 5 Brands Click Share
The combined click share by top 5 brands compared to all brands in the niche.
Top 20 Brands Click Share
The combined click share by top 20 brands compared to all brands in the niche.
Average Brand Age in Niche (past 360 days)
Average age of brands (based on launch dates of the top products within niche)
# of Selling Partners (past 360 days)
The number of selling partners making offers on products in this niche
Average number of buyable offers on ASINs in the niche from both third-party sellers and first-party vendors (that is, an average of a daily snapshot of offer depth) in the past 360 days. Note: Offer from Amazon retail counts as one offer, regardless how many vendors retail sources the product from.
Average Selling Partner Age in Niche
The average amount of time selling partners offering the current products in the niche have offered at least one product in this niche
# of New Products Launched (past 180 days)
ASINs launched within last 90 and 360 days
This is how many products that have been launched in the niche within the past X days that are in the Top 90% of clicks and purchases.
# of Successful Launches (past 180 days)
Number of new launches (in the past 180 days) with an annualized revenue amount > $50k in the past 30 days
This provides an overview of how many new product launches, in the past X days, within the top 90% of clicks and purchases are projected to make at least $50k in revenue for the year based on the last 30 days of sales.
# of New Products Launched (past 360 days)
Number of products with a launch date on Amazon in the last 360 days
This is how many products that have been launched in the niche within the past X days that are in the top 90% of clicks and purchases.
# of Successful Launches (past 360 days)
Number of new launches (in the past 360 days) with an annualized revenue amount > $50k in the past 30 days
This provides an overview of how many new product launches, in the past X days, within the Top 90% of clicks and pruchases are projected to make at least $50k in revenue for the year based on the last 30 days of sales.
Average Review Rating : Average Product Rating for each product within the niche
Average Out of Stock Rate (past 360 days): Average out of stock rate for all products in niche.
Average Product Listing Quality: Average listing quality score for all products in the niche.
A score out of 100 that evaluates listings within the niche based on how complete the content on the detail page is.
Niche Details: Products
ASIN Details
Product Name | ASIN
Product name (of the ASIN). This is a clickable link that takes you to the Product Detail Page.
Image
Top Image of the Product
ASIN
ASIN stands for Amazon Standard Identification Number. It’s a unique identifier of 10 letters and/or numbers for a product
Brand
Name of the brand of the product
Category
Path to the product within the Amazon browse hierarchy, up to 3 levels deep. Taxonomy depth varies across categories.
Launch Date
Date when ASIN’s first buyable offer is available on Amazon.
Demand
Niche Click Count (Past 360 days)
Total number of clicks on this product, after a customer sees the product as a result from any search term in this niche.
This number differs from the “Search Click Count” as it only includes the clicks that occur after a customer searches for one of the search terms included in this niche.
Click Share (Past 360 days)
Number of clicks on this product as a percentage of the total click count for every product shown in this niche for the past 360 days
Average Selling Price (Past 360 days)
Average selling price of products for the past 360 days
Customer Sentiment
Total Ratings (Past 360 days)
Total number of reviews for the product, as of the most current snapshot, data refers to the past 360 days. Currently this only includes reviews where the customer provided written product feedback.
Average Customer Rating (Past 360 days)
Average star rating customers gave the product in a review out of 5 stars for the past 360 days. Currently, this only includes reviews where the customer provided written product feedback.
Competition
Average Best Seller Ranking (Past 360 days)
The best seller ranking (BSR) of this product, within its specific sub category on Amazon. Note: Products in this niche may be part of different sub categories. To identify the BSR category, it can be viewed under each ASINs product metrics tab.
Average # of Sellers & Vendors (Past 360 days)
Average number of buyable offers on this product, over the past 360 days, from both third-party sellers (includes both brand owners and resellers) and first-party vendors. Note: Offer from Amazon retail counts as a single offer, regardless how many vendors the product may be sourced from. To identify Amazon retail offers, the listing will show sold by and shipped by Amazon on the product detail page
Niche Details: Search Terms
Search Term Definition
Search Term
Name of the search term customers entered when they intended to purchase products in this niche in the past 360 days
Top 3 Clicked Products
Top 3 clicked products within this search term in ranked order
Search Volume
Search Volume (Past 360 days)
The total number of searches customers entered for this particular search term on Amazon in the past 360 days.
Search Volume Growth (Past 90 days)
The percentage change in search volume in the past quarter (0-90 days), compared to the previous quarter (90-180 days ago).
Search Volume Growth (Past 180 days)
The percentage change in search volume in the past 180 days (0-180 days), compared to the previous 180 days (180-360 days ago).
Demand
Click Share (Past 360 days)
Number of clicks on products from customers who entered this search term, as a percentage of the total clicks from customers from every search term in this niche for the past 360 days.
Search Conversion (Past 360 days)
The total number of purchases within this niche in the past 360 days
Number of purchases, of any product in this niche, after a customer entered this search term and clicked on a product, divided by the total number of times customers entered this search term, conversions that are tracked across both mobile or desktop.
Niche Details: Trends
Search Volume
The total number of times customers entered any of the search terms in this niche on Amazon in the past 7 days.
IMPORTANT: We include all search terms issued within a day. For example, if the same search term is issued by the same customer session in a 24 hour time period more than once, we will include all of those instances in the total query volume. Also, clicking on the next page of search results will increment search volume.
Product Count
The number of products in this niche in the past 7 days. The niche will include all of the top-clicked products that cumulatively received 90% of clicks after customers entered any search term in the niche
Average Price
The average selling price for all products in this niche in the past 7 days
Search Conversion Rate
The total number of purchases within this niche in the past 7 days
Number of purchases, of any product in this niche, after a customer entered this search term and clicked on a product, divided by the total number of times customers entered this search term, conversions that are tracked across both mobile or desktop
Selling Partner Count
The number of selling partners making offers on products in this niche within last 7 days
Average number of buyable offers on ASINs in the niche from both third-party sellers and first-party vendors (that is, an average of a daily snapshot of offer depth) in the past 7 days.Note: Offer from Amazon retail counts as one offer, regardless how many vendors retail sources the product from.
Brand Count
Number of brands for all products in the niche.
Niche Details: Purchase Drivers
Positive Drivers
Features specific to this niche that positively impact the number of units sold by products within it. The impact is calculated by comparing the estimated sales of the products with that feature against the average units sold by all products in the niche.
- For all niches with more than 30 products, we present up to 10 most relevant positive features with at least 1% impact on units sold. As these features are analyzed independently, the impact of including all of them is not the same as adding each individual percentage change.
- Some features may have a classification attributed to it (e.g. material, style, size) and its purpose is to facilitate interpretation, however they should not be considered an exhaustive list of all categories of variations.
- For example, if “black” is a positive feature with an estimated impact of 15% in the t-shirts niche, assuming the average units sold for all products in this niche is 100, then products with this feature of “black” would have an increased units sold by 15.
- The positive percent impact numbers are capped at 500% per feature. This is being done to disregard extreme values that can arise because of outliers in a large data population that is normally distributed. The statistical confidence level at the extreme ends is not always high, and it is better to consider these numbers as directionally large positive numbers rather than using their actual numerical value.
Negative Drivers
Features specific to this niche that negatively impact the number of units sold by products within it. The impact is calculated by comparing the estimated sales of the products with that feature against the average units sold by all products in the niche.
- For all niches with more than 30 products, we present up to 10 most relevant negative features with at least 1% impact on units sold. As these features are analyzed independently, the impact of including all of them is not the same as adding each individual percentage change.
- Some features may have a classification attributed to it (e.g. material, style, size) and its purpose is to facilitate interpretation, however they should not be considered an exhaustive list of all categories of variations.
- For example, if “style: gaming laptop” is a negative feature with an estimated impact of 10% in the laptop niche, assuming the average units sold for all products in this niche is 1000, then products with this feature of “style: gaming laptop” would have a reduced units sold by 100.
- The negative percent impact numbers are capped at -85% per feature. This is being done to disregard extreme values that can arise because of outliers in a large data population that is normally distributed. The statistical confidence level at the extreme ends is not always high, and it is better to consider these numbers as directionally large negative numbers rather than using their actual numerical value.
Niche Details: Customer Review Insights
Customer Review Insights
Topic/Subtopic
Most common customer sentiments for products in the niche based on customer ratings with text reviews for products in the niche.
These topics can help identify which features are most important to customers when creating a new product in this niche.
%Mentions
Frequency of mention of a theme or product attribute within all customer reviews for the niche (in past 6 months), presented as a percentage.
- Number of mentions for a review topic divided by the total number of mentions across all topics for the niche in past 6 months, presented as a percentage.
- For subtopics, the percentage refers to its contribution to the main topic. For example, if the main topic has 20% mentions and one subtopic has 75%, it means that such subtopic contributes 3/4 to the main topic.
Review Snippets
Sample phrasing from actual customer reviews on ASINs within the niche at topic/sub-topic level.
Topic Impact on Star Rating
All Products in Niche
Visualization of how the review topic positively or negatively impacts the star rating of products in a niche. This is based on data collected in past 6 months.
For Example, if a niche has an impact on star rating of -0.5 for a topic, then this means that -0.5 is the contribution of the topic to the average star rating of the niche.
Top 25% Products in Niche
Visualization of how the review topic positively or negatively impacts the star rating of the top 25% products in a niche. This is based on data collected in past 6 months.
Customer Review Topic Mentions Trends
All Products in Niche
Trend of positive or negative review topics in the past 6 month period and Month-over-Month change at a specific topic available in the Customer Review Insights tab for all the products in the niche.
Top 25% Products in Niche
Trend of positive or negative review topics in the past 6 month period and Month-over-Month change at a specific topic available in the Customer Review Insights tab for the top 25% products in the niche.
ASIN Details: Customer Review Insights
Customer Review Insights
Topic/Subtopic
Most common customer sentiments based on customer ratings with text reviews for this product.
These topics can help identify which features are most important to customers when creating a new product in this niche.
#Mentions (%)
Frequency of mention of a theme or product attribute within all customer reviews for the product (in past 6 months), presented as a number and percentage.
- Number of mentions for a review topic divided by the total number of mentions across all topics for the product in past 6 months, presented as a percentage.
- For subtopics, the percentage refers to its contribution to the main topic. For example, if the main topic has 20% mentions and one subtopic has 75%, it means that such subtopic contributes 3/4 to the main topic.
#Mentions (%) – Parent ASIN
Frequency of mention of a theme or product attribute within all customer reviews for products within the Parent-ASIN (in past 6 months), presented as a number and percentage.
%Mentions – Category
Frequency of mention of a theme or product attribute within all customer reviews for products within the Category (in past 6 months), presented as a percentage.
Child with Most Mentions
Displays the product with most mentions within the Parent-ASIN for the topic.
Child with Least Mentions
Displays the product with least mentions within the Parent-ASIN for the topic.
Review Snippets
Sample phrasing from the customer review that provides detail into the topic/sub-topic.
Topic Impact on Star Rating
ASIN
Visualization of how the review topic positively or negatively impacts the star rating of an ASIN. This is based on data collected in past 6 months.
For Example, if an ASIN has an impact on star rating of -0.5 for a topic, then this means that -0.5 is the contribution of the topic to the average star rating of the product.
Parent ASIN
Visualization of how the review topic positively or negatively impacts the star rating across all products within the Parent-ASIN. This is based on data collected in past 6 months.
Category
Visualization of how the review topic positively or negatively impacts the star rating of all products in the category (corresponding to selected ASIN). This is based on data collected in past 6 months.
Customer Review Topic Mentions Trends
ASIN
Trend of positive or negative review topic in the past 6 month period and Month-over-Month change at a specific topic available in the Customer Review Insights tab for the product/ASIN.
Parent ASIN
Trend of positive or negative review topic in the past 6 month period and Month-over-Month change at a specific topic available in the Customer Review Insights tab for all the products within the Parent-ASIN.
Category
Trend of positive or negative review topic in the past 6 month period and Month-over-Month change at a specific topic available in the Customer Review Insights tab for all the products in the Category.
Niche Details: Returns
Product Returns Insights
Topic
Most common customer reasons for returning a product in the niche. These reasons are extracted from return feedbacks for the niche provided by customers in the past 6 months.
These topics can help identify which features are most important to customers when creating a new product in this niche.
%Mentions
Frequency of how often the theme is mentioned as compared to all returns for products in the niche from data collected in the past 6 months.
Topic Returns Trend
All Products in Niche
Percentage of return mentions and Month-over-Month change over past 6 months for each topic available in the Product Returns Insights


