Table of Contents
Stop chasing the wrong numbers. Most Amazon sellers are drowning in data but starving for insight, obsessing over vanity metrics like a low ACoS while their profits flatline and competitors steal market share. This is a strategic trap we call Optimization Myopia, a dangerous focus on metrics that look good on a dashboard but tell you nothing about your actual profitability.
The hidden costs are staggering: unprofitable ad spend, missed growth opportunities, and strategic paralysis. You’re busy tweaking dials while your competitors are building a real asset.
This guide is your wake-up call. We’re cutting through the noise to give you the specific Amazon KPIs that separate stagnant sellers from seven-figure powerhouses. You’ll learn to stop guessing and start making the profit-driven decisions that build a defensible, scalable brand.
Ditching Vanity for Profit
The first step is learning to distinguish between numbers that stroke your ego and numbers that build your bank account. One tells a story; the other drives the narrative.
Think about it: a huge number of impressions looks impressive, but what does it matter if no one clicks or buys? It’s just noise. A super-low ACoS is worthless if your total revenue is flat. All you’re doing is managing your decline efficiently.
This simple shift moves your focus from surface-level activity to real business outcomes. It’s the difference between being busy and being profitable. Let’s put these metrics side-by-side to make the distinction crystal clear.
Vanity Metrics vs. Money Metrics on Amazon
| Metric Type | Common Example | What It Tells You | The Hidden Risk |
|---|---|---|---|
| Vanity Metric | Impressions | How many times has your ad been displayed? | High impressions with a low click-through rate means your targeting is off, or your creative is weak. You’re wasting money on unqualified eyeballs. |
| Money Metric | Contribution Margin | Profit left after variable costs (including ad spend) | Misjudging CAC or over-optimizing low-margin products |
The takeaway is simple: one metric makes you feel productive, while the other actually moves the needle on your P&L. Once you learn to spot the difference, you can finally start making decisions that build long-term value.
The Core Advertising KPIs That Drive Profitability
Let’s get straight to it. Your advertising performance isn’t just about how much you spend; it’s about what that spend builds. Too many sellers get laser-focused on a single, misleading metric, completely missing its true impact on their bottom line. This is where profitable brands pull away from the pack.
We’ll start with the most famous, and most misused, Amazon KPI, but I’ll quickly show you why stopping there is a massive mistake.
ACoS: The Good, The Bad, and The Ugly
Advertising Cost of Sales (ACoS) is the default metric for a reason. It’s simple, direct, and tells you how much you spent on ads to generate one dollar of ad-attributed sales.
Formula: ACoS = (Ad Spend / Ad Revenue) x 100
(RoAS is the inverse of ACoS: RoAS = Ad Revenue / Ad Spend. Some sellers prefer RoAS for its intuitive focus on return rather than cost.)
A low ACoS feels good, right? It screams efficiency. But chasing a low ACoS at all costs is a classic rookie move. I’ve seen countless brands throttle their bids, slash their budgets, and proudly watch their ACoS drop… while their total sales completely flatline. You’re efficiently managing your own decline.
ACoS is a tactical metric, not a strategy. It’s useful for campaign management, but relying on it alone will strangle growth.
Efficiency is not incrementality. A campaign can show strong RoAS while simply harvesting branded demand. If your spend isn’t expanding impression share across generic and competitor terms, you’re defending, not growing.
This is why serious brands move beyond surface-level optimization and adopt a structured Amazon PPC management strategy built around incrementality and total contribution margin.
TACOS: The True Measure of Advertising Impact
This brings us to the single most important advertising KPI for any serious Amazon brand: Total Advertising Cost of Sales (TACOS). This metric measures your ad spend against your total revenue—both paid and organic sales combined.
Formula: TACOS = (Ad Spend / Total Revenue) x 100
Why does this matter so much? Because effective advertising does more than just buy sales, it creates a powerful halo effect. It boosts your organic ranking, increases brand visibility, and drives customers who might see an ad but come back later to purchase organically.
TACOS captures this full picture. It answers the real question every brand owner should be asking: “Is my advertising investment building a stronger, more self-sufficient brand on Amazon?”
The Takeaway: A declining TACOS over time, even with a stable ACoS, is the ultimate sign of healthy growth. It proves your ad spend is creating a flywheel, making your entire business more profitable and less dependent on paid clicks.
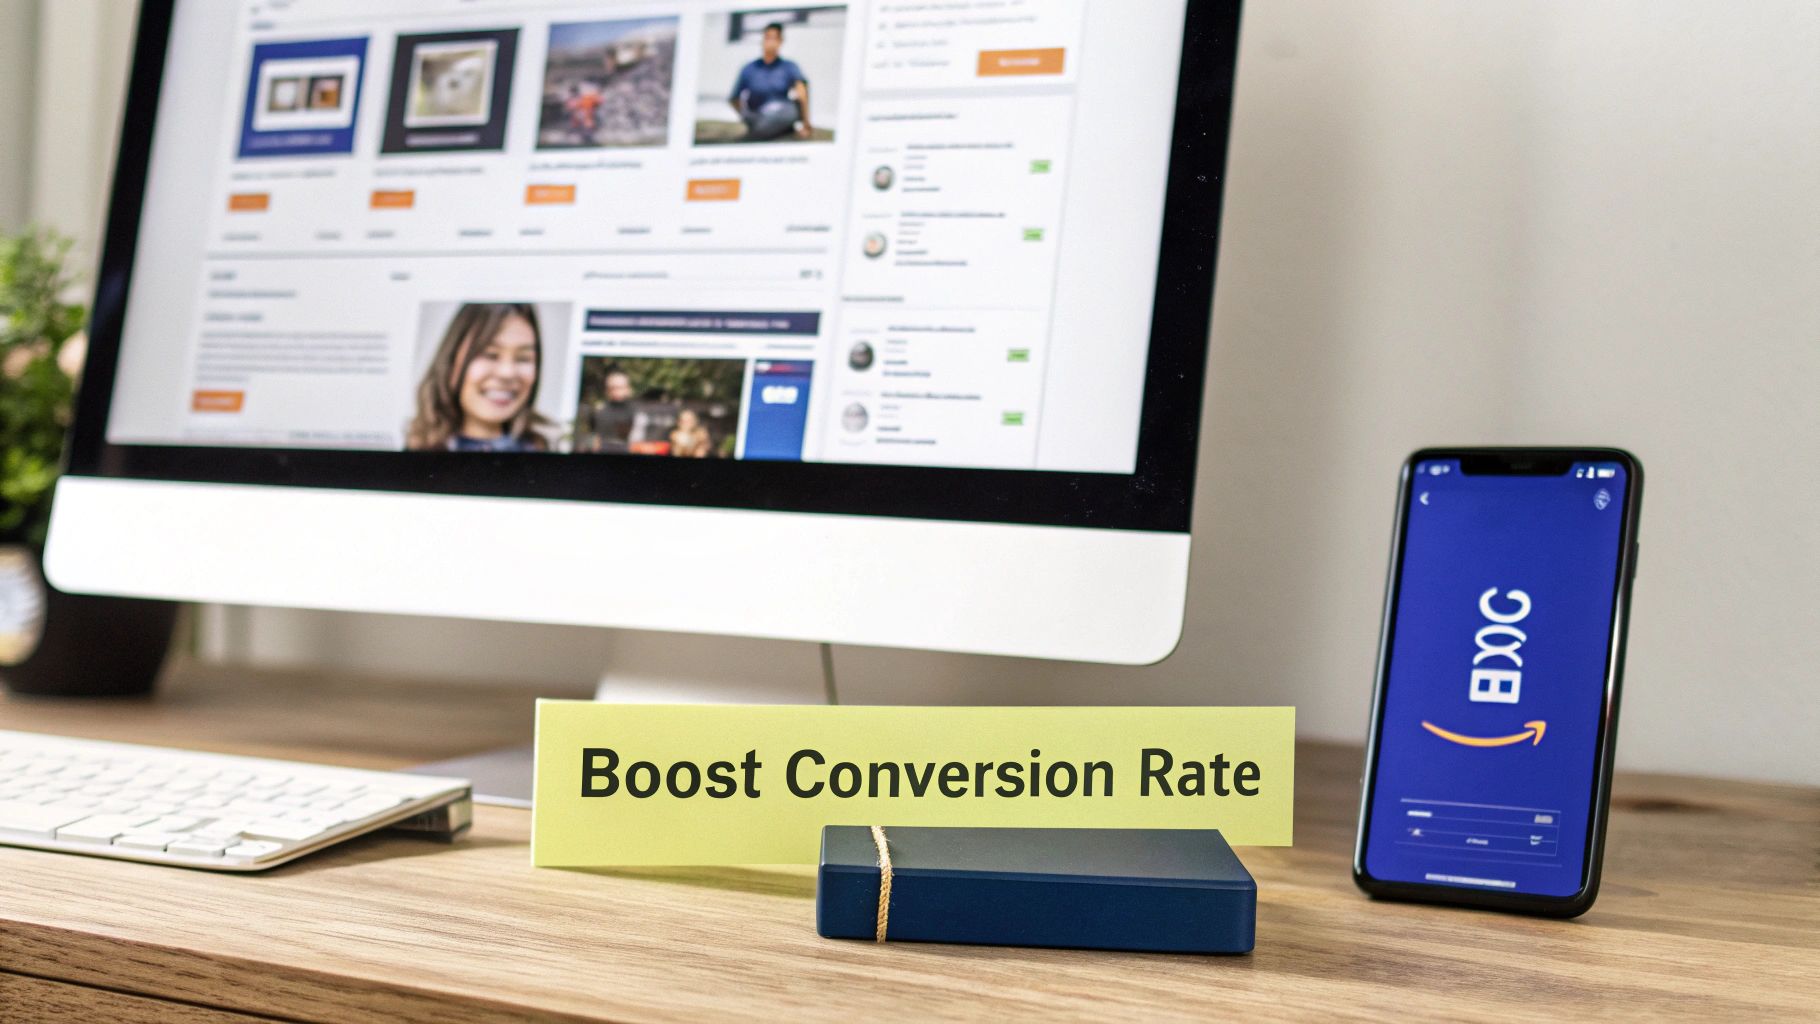
This chart visualizes the critical difference between metrics that feel productive (“Vanity Metrics”) and those that actually build your business (“Money Metrics”).
It’s clear that focusing on “Money Metrics” like TACOS gives you a complete view of your business health, unlike the tunnel vision you get from “Vanity Metrics.”
Mastering Your Listing and Conversion Performance
Pouring money into a killer advertising strategy is pointless if your product detail pages can’t close the deal. All that high-cost traffic simply bounces, and your ad budget evaporates. This is where we shift focus from bringing customers to the page to what happens on the page.
These are the Amazon KPIs that measure the raw selling power of your listings. Your advertising gets the click; your listing must get the sale. The metrics in this section are the ultimate report card on your images, copy, pricing, and reviews. Master them, and you’ll build a conversion engine that makes every ad dollar work harder.
Unit Session Percentage: The Ultimate Listing KPI
If you could only track one listing-related KPI, it should be Unit Session Percentage. Often just called conversion rate, this metric tells you what percentage of sessions (visits to your page) result in a purchase.
Formula: Unit Session Percentage = (Units Ordered / Total Sessions) x 100
This number is the purest measure of your listing’s effectiveness. A high conversion rate tells the Amazon algorithm that customers who land on your page find what they want and buy it. This, in turn, boosts your organic ranking, creating a positive feedback loop.
If this metric is underperforming, your issue isn’t traffic — it’s conversion architecture, merchandising, or positioning — all of which require structured Amazon listing optimization services.
Key Insight: A declining Unit Session Percentage is an early warning sign that something is wrong. It could be a new competitor undercutting your price, a batch of negative reviews, or stale creative that no longer connects with shoppers.
Diagnosing a low conversion rate requires a systematic check-up:
-
Pricing: Are you competitive?
-
Main Image: Does it stop the scroll and clearly show the product?
-
Reviews: Is your rating above 4.2 stars? Are recent reviews tanking your average?
-
A+ Content: Does it answer key customer questions and build brand trust?
The principles of optimizing your product listings for maximum impact and higher sales extend beyond Amazon. For a broader perspective on driving conversions, learn how to optimize business listings for conversions on other key platforms.
Sessions: The Fuel for Your Sales Engine
Sessions are simply the number of visits to your product pages within a specific period. While it might seem basic, this Amazon KPI is fundamental to understanding your traffic sources and growth potential. Without sessions, you have no chance to convert.
It’s critical to analyze sessions alongside your Unit Session Percentage. For instance:
-
High Sessions, Low Conversion: This points to a traffic problem (you’re driving irrelevant clicks) or a listing problem (your page isn’t convincing).
-
Low Sessions, High Conversion: You have a great product page, but not enough people are seeing it. The solution is to ramp up advertising and SEO efforts to increase visibility.
You can find this data in the “Detail Page Sales and Traffic” report within Seller Central Business Reports. Use it to see where your traffic is coming from—organic vs. paid—and understand how your marketing efforts are impacting overall visibility. A steady increase in total sessions is a strong indicator of a healthy, growing brand.
Buy Box Percentage: The Key to Getting Paid
For sellers who compete with resellers or other third-party merchants, the Buy Box Percentage is a non-negotiable Amazon KPI. This metric shows the percentage of page views where your offer was featured in the “Add to Cart” box.
If you aren’t in the Buy Box, you aren’t making the sale—it’s that simple. Losing the Buy Box kills your sales velocity and renders your PPC ads useless, as Amazon won’t show ads for a product if you don’t own the Buy Box.
Several factors influence your Buy Box win rate:
-
Price Competitiveness: Your landed price (price + shipping) must be sharp.
-
Fulfillment Method: Fulfillment by Amazon (FBA) is heavily favored over Fulfillment by Merchant (FBM).
-
Shipping Speed: Fast and reliable delivery times are crucial.
-
Seller Feedback Score: A high rating signals trustworthiness to Amazon.
A sudden drop in your Buy Box Percentage is a red alert. It usually means a reseller has undercut your price or your inventory has run out. Monitor this daily if you operate in a competitive environment. Winning it back requires aggressive repricing, ensuring stock availability, and maintaining pristine account health. It’s not just a metric; it’s the gateway to your revenue.
Business-Level KPIs for Holistic Growth and Market Dominance
If the metrics we’ve covered so far are for the managers on the ground, this section is for the CEO’s office. We’re moving past the day-to-day performance of campaigns and listings to focus on the big-picture Amazon KPIs that signal true business health and market position.
These are the numbers that private equity firms, enterprise brands, and serious investors care about. They tell a story not just about today’s sales, but about the long-term value and defensibility of your brand as an asset.
Average Order Value (AOV)
Average Order Value (AOV) is the average dollar amount spent each time a customer checks out. It sounds basic, but it’s an incredibly powerful lever for profitability. Getting a customer to spend $60 instead of $40 in a single transaction costs you almost nothing in extra acquisition costs.
Formula: AOV = Total Revenue / Number of Orders
Boosting your AOV comes down to smart product bundling, cross-selling, and up-selling. The best place to start is Amazon’s Market Basket Analysis report. It shows you which of your products are most frequently bought together.
If customers constantly buy your shampoo and conditioner separately, why aren’t you selling them as a higher-priced bundle? This isn’t just a sales tactic; it’s a direct path to increasing profit margins on every single transaction without needing more traffic.
Share of Voice (SOV)
Share of Voice (SOV) measures your brand’s visibility on the digital shelf compared to your competitors. It answers a simple but brutal question: “When a customer searches for our most important keywords, do they see us or someone else?” In the crowded Amazon marketplace, brand visibility is market share.
While there’s no direct SOV report in Seller Central, you can piece it together by tracking your ad impression share for top keywords and your organic rank for those same terms. Tools like Adverio’s proprietary RegionRank system can automate this, giving you a crystal-clear picture of where you stand.
A high SOV is a leading indicator of future sales. It means you are capturing customer attention at the most critical stage of their buying journey. Use this data to inform both your PPC and Amazon DSP advertising strategy, especially when expanding upper-funnel visibility, retargeting non-converting traffic, and investing more aggressively in keywords where you’re losing ground.
Inventory Performance Index (IPI)
If you’re using Fulfilled by Amazon (FBA), your Inventory Performance Index (IPI) score is more than just a metric—it’s a gatekeeper. A low IPI can trigger storage limits, higher fees, and a throttled ability to scale. This score reflects how efficiently you manage inventory: sell-through rates, excess stock, stranded listings, and more.
An IPI below 400 is a red flag. It usually means your products are sitting too long, not moving fast enough, or you’ve got backend cleanup to do. Amazon penalizes this by limiting your storage space, which can choke future sales and inflate your fulfillment costs. Regularly auditing inventory age and running targeted clearance promotions helps you stay lean and profitable.
Customer Return Rate
Most sellers see returns as a cost center—a frustrating hit to the bottom line. This is a massive strategic mistake. Your Customer Return Rate is one of the most honest and valuable feedback loops you have.
Formula: Return Rate = (Number of Units Returned / Total Units Sold) x 100
A high or rising return rate isn’t just a financial problem; it’s a product or listing problem. Dive into the return reasons. Are customers saying the product “doesn’t match the description”? Your listing copy or images are misleading them. Is the reason “defective”? You have a quality control issue with your supplier.
Instead of just processing the refund, use this data to:
-
Refine Your Listings: Clarify sizing, materials, or features to set accurate expectations.
-
Improve Product Quality: Send direct, data-backed feedback to your manufacturer.
-
Enhance Customer Experience: Proactively address common issues in your A+ Content.
When you treat your return rate as a strategic Amazon KPI, you turn a cost into an investment in product improvement and customer trust.
Customer Lifetime Value (CLTV)
Customer Lifetime Value (CLTV) is the ultimate metric for anyone serious about building a brand, not just selling products. It predicts the total revenue you can expect from a single customer over their entire relationship with your business.
While it’s notoriously difficult to track perfectly on Amazon, you can create powerful directional estimates using repeat purchase data from Brand Analytics.
Understanding CLTV fundamentally changes how you view your customer acquisition costs. A brand with a $150 cLTV can afford to spend far more to acquire a new customer than a brand that only focuses on the profit from a single $30 sale. This is where you can start utilizing SKU economics on Amazon to maximize long-term profitability across your entire catalog. This long-term perspective allows you to invest in top-of-funnel Amazon DSP advertising strategies and brand-building campaigns that transaction-focused competitors simply can’t justify.
If you’re unsure which KPIs are truly incremental versus defensive, it’s time to pressure-test your numbers.
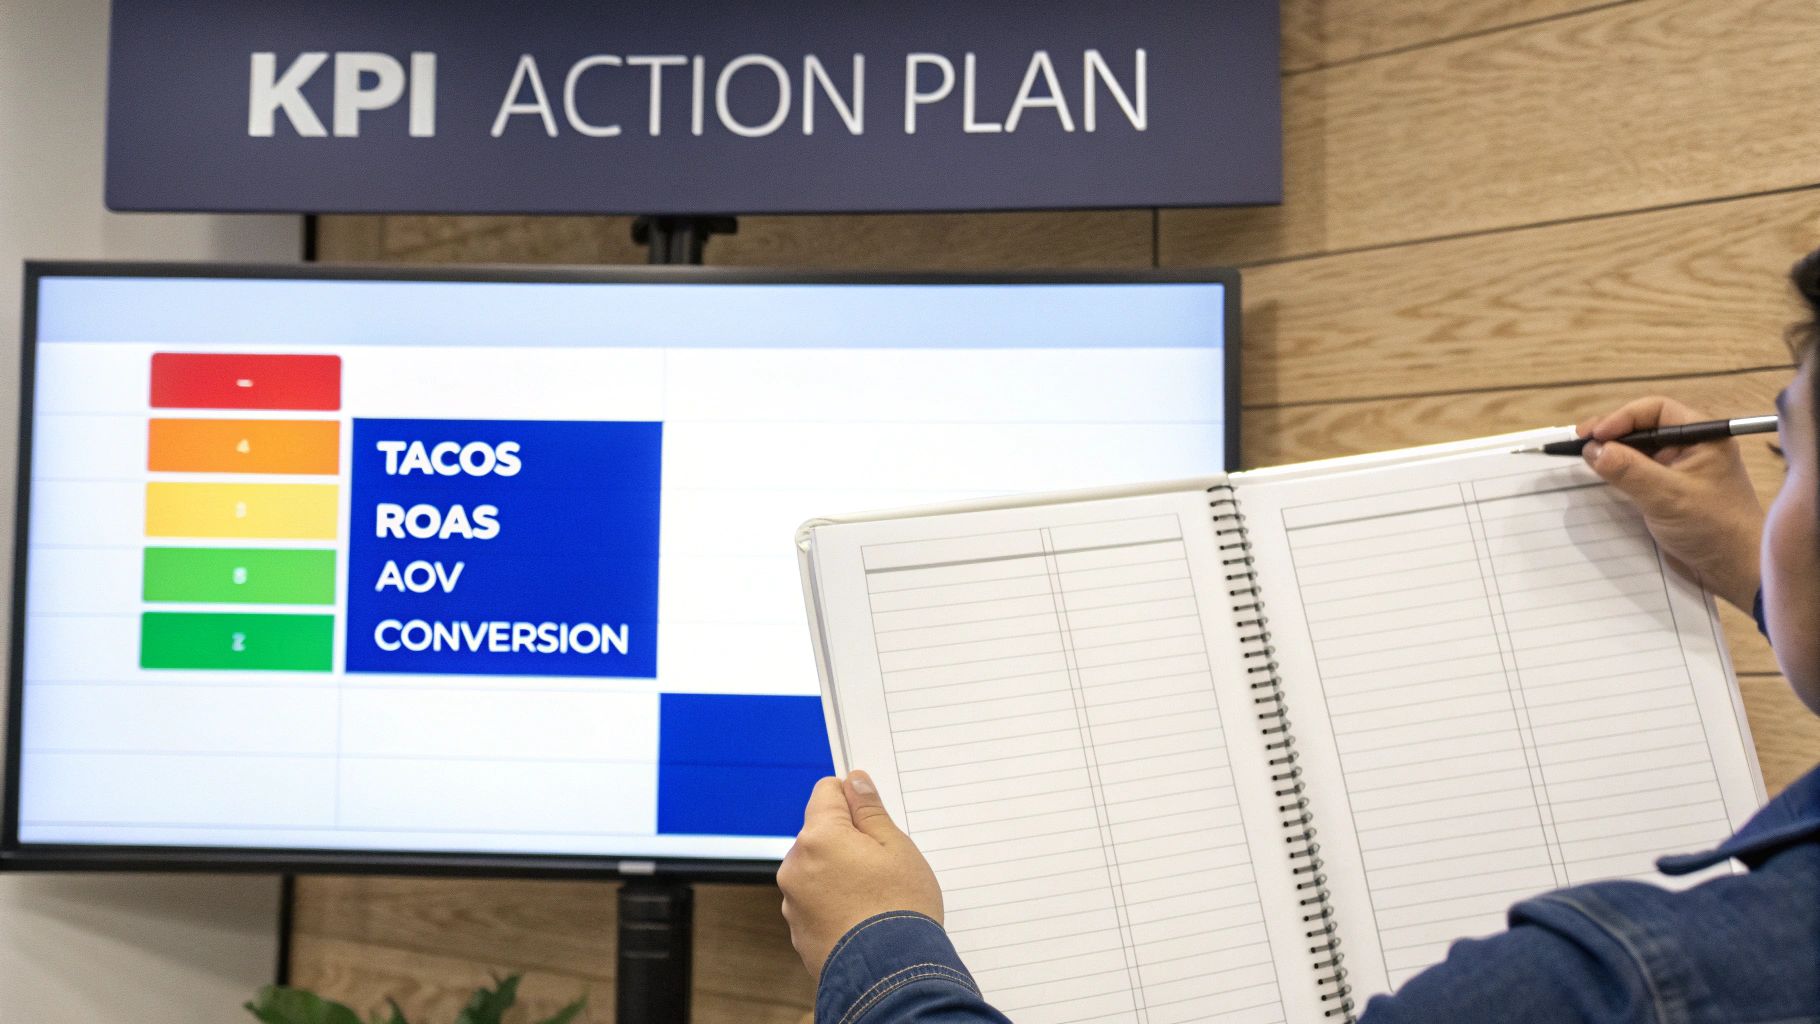
Building Your Amazon KPI Dashboard and Action Plan
Data without deployment is wasted potential. You now have the list of critical Amazon KPIs that separate stagnant sellers from seven-figure powerhouses. But that knowledge is worthless if it just sits in a report. This is where we turn insights into profitable action.
The goal isn’t to build a complex dashboard that leaves you paralyzed by data overload. It’s to create a focused tool that puts your most important ‘money metrics’ front and center. It doesn’t matter if you use a fancy third-party platform or a simple spreadsheet—the principle is the same: clarity over clutter.
From Dashboard to Diagnosis
A great dashboard doesn’t just show you numbers; it tells you a story. It should flag problems long before they spiral out of control. Think of it as your business’s health monitor, connecting the dots between different KPIs so you can make an instant diagnosis. If you need inspiration for designing your own, exploring various business intelligence dashboard examples is a great place to start.
Ultimately, your dashboard should be built to answer a few high-stakes questions at a glance:
-
Is my advertising actually driving profitable, holistic growth? (Check the TACOS trend).
-
Are my product pages effectively converting the traffic I’m paying for? (Look at Unit Session Percentage).
-
Are we capturing or losing ground to our key competitors? (Review Share of Voice).
-
Are customers spending more with us over time? (Track AOV and repeat purchases).
This diagnostic approach shifts you from reactively chasing daily sales figures to proactively managing the levers of sustainable growth.
Setting Targets and Defining Action
Once your dashboard is live, the real work begins. You must translate what the data is telling you into a concrete action plan. That means setting realistic targets and defining the specific steps you’ll take when a metric starts trending in the wrong direction.
A KPI without a target is just a number. Establish a baseline for each core metric, then set achievable quarterly goals. For instance, if your current TACOS is 15%, a realistic goal might be to lower it to 12% over the next 90 days by improving your organic rank for high-volume keywords.
Key Takeaway: Your plan should operate on a simple “if-then” framework. If TACOS is rising while Conversion Rate is falling, then the first action is to audit the A+ content and main images on our top ad-spend ASINs. This creates a clear, repeatable process for optimization.
A well-structured action plan connects a problem indicator to a concrete solution. It removes guesswork and ensures your team is focused on the highest-impact activities. For brands looking to unify this data into a single, profit-focused lens, exploring advanced profit-first marketplace business intelligence platforms is the logical next step.
A Framework for Prioritizing Your Next Move
The final step is turning your diagnosis into a prioritized to-do list. Not all problems are created equal. A 5% drop in conversion rate on your hero product is a five-alarm fire. A slight dip in AOV on a low-volume SKU? That’s a low-priority task for another day.
Here’s a simple framework to help you prioritize what to fix first:
-
Stop the Bleeding: First, address any KPI that is actively costing you significant money or market share. This includes a sudden spike in ACoS, a loss of the Buy Box on a key product, or a sharp increase in your customer return rate.
-
Fix the Conversion Engine: Next, focus on improving your Unit Session Percentage. Optimizing your listings makes every other effort—especially advertising—more effective and profitable.
-
Scale What’s Working: Finally, identify your highest-performing products (strong conversion, good margins) and double down. Increase ad spend, protect your organic rank, and build a competitive moat.
This disciplined approach ensures you’re always working on the thing that will make the biggest difference to your bottom line. It’s how you move from being managed by your metrics to being a manager of your growth.
KPI-Driven Action Plan
| KPI Indicator | Potential Problem | First Action Step | Adverio Solution |
|---|---|---|---|
| TACOS is increasing | Ad spend is growing faster than total sales, indicating reliance on ads vs. organic. | Audit top ad-spend keywords. Are bids too high for terms where you already rank #1 organically? | We use our Growth Cultivator framework to rebalance spend toward incremental growth, protecting profitable organic sales. |
| Unit Session Percentage is dropping (Amazon’s version of conversion rate) | The product page isn’t converting, which could be due to pricing, bad reviews, or poor creative. | Analyze the Voice of the Customer (VOC) report and recent reviews to identify new customer pain points or objections. | Our team performs a full-funnel audit, optimizing everything from main images and A+ content to review management. |
| AOV is stagnant or falling | Customers aren’t bundling items or upgrading. There may be no clear upsell path or virtual bundle opportunity. | Create and test virtual bundles pairing your top-seller with a complementary, lower-priced item. | We identify and build data-backed bundling strategies to increase basket size without raising ad costs. |
This is how you build a system, not just a dashboard. It’s a repeatable process for diagnosing issues and deploying the right fix every single time, turning your data into a predictable, profitable scale.
How Adverio Turns KPIs Into Profit Systems
Most brands track KPIs. Very few govern them.
At Adverio, we don’t optimize dashboards — we engineer profit systems. Our Growth Cultivator framework connects catalog optimization, PPC, DSP, and business intelligence into one coordinated execution model.
If your KPIs aren’t translating into margin expansion or market share gains, the problem isn’t effort — it’s governance.
👉 Explore our Amazon PPC Management Services
Frequently Asked Questions About Amazon KPIs
We’ve walked through the core metrics, the frameworks to make sense of them, and how to turn data into action. But let’s be honest, this is where the theory meets reality, and a few common questions always pop up when sellers start getting serious about their KPIs.
What Is a Good TACOS for an Amazon Business?
This is one of those “it depends” questions, but that’s actually good news. There’s no single magic number for TACOS. The “right” target is unique to your product category, your margins, and, most importantly, where you are in your business journey.
For a brand launching a new product, a TACOS of 20-25% might be perfectly reasonable. You’re not chasing profit at that stage; you’re buying data, visibility, and market share. On the other hand, a mature product with a strong organic footing should be aiming for a TACOS well under 10%.
The number itself isn’t what matters most. It’s the trend. A TACOS that’s consistently dropping tells you your advertising is doing its job—building organic rank and brand equity. That’s the real sign of a healthy, efficient growth engine.
How Often Should I Check My Amazon KPIs?
It’s tempting to live inside your Seller Central dashboard, hitting refresh every hour. Don’t. Checking metrics daily is a surefire way to make reactive, emotional decisions based on normal market noise. You’ll get lost in the weeds and drive yourself crazy.
Instead, find a rhythm that works for you. Here’s what we recommend:
-
Weekly Review: This is the sweet spot for strategic KPIs like TACOS, Conversion Rate, and Share of Voice. Looking at your data week-over-week smooths out the daily bumps and lets you spot trends that actually mean something.
-
Bi-Weekly/Twice-Weekly Review: More tactical metrics—think campaign-level ACoS, clicks, and ad spend—can be checked every two or three days. This gives Amazon’s attribution window enough time to catch up, so you’re looking at more accurate performance data.
My ACoS Is Low, but My Sales Are Flat. What KPI Should I Look at Next?
This is a classic case of over-optimizing efficiency while starving growth. A low ACoS with stagnant sales indicates that your ad strategy is efficient but ineffective at driving growth. You’re protecting a vanity metric at the expense of your business’s health.
The first Amazon KPI to check is your TACOS. It will cut through the noise and show you the real (and probably tiny) impact your ad spend is having on your total top-line revenue.
From there, pull up your Sessions report. If traffic is flat, that confirms your low ad spend isn’t actually bringing new shoppers to your listings. It’s time to strategically open up the ad budgets, likely on high-potential keywords where you can start climbing the ranks. Finally, look at your Share of Voice to see if competitors are eating your lunch and stealing market share while you’re admiring a meaningless ACoS.
Most Amazon sellers are flying blind, drowning in data but starved for direction. At Adverio, we turn your scattered metrics into a clear, actionable plan that scales your profit, not just your spend.
If your dashboards look “healthy” but profit isn’t scaling, you’re likely optimizing the wrong levers.
👉 Book Your ROI Forecast and see where incrementality is leaking inside your account — before your competitors take it.